Thanks. You have a quite respectable size setup.
Forgot to post the group delay and normalized polar.
Forgot to post the group delay and normalized polar.
An externally hosted image should be here but it was not working when we last tested it.
An externally hosted image should be here but it was not working when we last tested it.
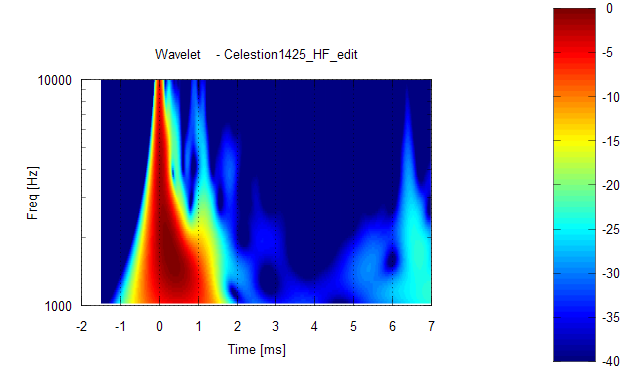
Here is the BMS4550 on the QSC waveguide. It would be interesting to see the difference in the compression drivers with the same waveguide.
http://www.penngray.com/htroom/waveguides/BMS4450_HF.wav
http://www.penngray.com/htroom/waveguides/BMS4450_HF.wav
btw, will your ARTA lessons be in French?")
Since he is doing them for Melaudia, but of course!
But J-M usually translates his stuff into English. If he wants, I'll help with the translation. I used to do English/French technical manuals.
Doug, that won't import into ARTA. Can you export it as a 16-bit PCM wav or can someone convert it?Here is the BMS4550 on the QSC waveguide. It would be interesting to see the difference in the compression drivers with the same waveguide.
http://www.penngray.com/htroom/waveguides/BMS4450_HF.wav
Doug, that won't import into ARTA. Can you export it as a 16-bit PCM wav or can someone convert it?
I wonder what was different then the other....hmmm. I will check for you.
Doug, that won't import into ARTA. Can you export it as a 16-bit PCM wav or can someone convert it?
Try it again, I opened it into Audacity and then exported it as a 16-bit PCM, of course I saved it as 4450 and not 4550
but I know what it is.
Last edited:
Hello Doug20,
For what its worth: here attached a graph with frequency response, group delay curve and CSD obtained using ARTA on your wave file.
Best regards from Paris, France
Jean-Michel Le Cléac'h
Hello Doug,
Thank you for the measurement data. Very interesting.
Here's the 3 cycle wavelet transform of the impulse response.
Those plots are a impressive demonstration what we possibly could gain once wavelet analysis gets implemented in one of the common measurements packages !
I had a look into that Octave software - only to find out that that's way too much "matlab style" for me.
I possibly (?) could make it beyond the learning curve - but its too much effort for me, not being a math head at all...
Michael
Last edited:
ARTA uses wavelets for the Burst Decay sonograms but the time axis is in periods rather than ms.Those plots are a impressive demonstration what we possibly could gain once wavelet analysis gets implemented in one of the common measurements packages !
I had a look into that Octave software - only to find out that that's too much "matlab style" for me.
Michael
Still doesn't work but that reminded me that I'd been meaning to install Audacity so here it is.
Thanks, I will change it.
Hello Jean-Michel,
Here's the wavelet transform from the IR file you posted. Notice this is a 2 cycle wavelet, so it's giving more temporal resolution than the other ones I posted previously.
The plot is 300Hz-20kHz.
There is a lot of information in this picture!
- Elias
Here's the wavelet transform from the IR file you posted. Notice this is a 2 cycle wavelet, so it's giving more temporal resolution than the other ones I posted previously.
The plot is 300Hz-20kHz.
There is a lot of information in this picture!
- Elias
You'll find in attached file (in text format) as .wav (48kHz, 16 bits) the impulse reponse I measured on one of my horns (Fc = 320Hz, T = 0.707). The driver is the TAD TD2001.
Attachments

ARTA uses wavelets for the Burst Decay sonograms but the time axis is in periods rather than ms.
Thats good news ! - so an update for us from Ivo Mateljan is possibly only a few lines of code away...
I have looked into a few measurements of mine by burst decay, but - no surprise - its too hard to get useful / intuitively pictures as structures are simply not equidistant for mouth reflections ....
Michael

Hello,
No problem. It's a spirit of DIY
Yes, well, sometimes the real life is more compilicated than textbook picture There must be many simultaneous reflections/diffractions going on in the horn so hardly they will be organised in a straight row in the result. They sum up in a very complex way, I suppose.
The other thought of your is very good idea actually. I may think about how to calculate the "error" signal from the wavelet transfrom.
- Elias
Thanks again Jean-Michel and Elias – very impressive results either way !
No problem. It's a spirit of DIY
Elias – we see in the visualisation you got form Doug's IR file a certain repetitive structure – but its not *exactly* within the same spacing ( ~1ms) one would expect if those "multi path shadows" were from repetitive mouth reflection ?
Is there a possibility to improve about the visualisation ?
I mean, we know what the "ideal" plot would look like (the plot you have shown from your sound card measurement for example). If we then would subtract that "ideal behaviour" form what we see now, we would get the irregularities strongly highlighted – no?
Of course any GD (right shift) would have to be accounted for first.
Yes, well, sometimes the real life is more compilicated than textbook picture
There must be many simultaneous reflections/diffractions going on in the horn so hardly they will be organised in a straight row in the result. They sum up in a very complex way, I suppose.The other thought of your is very good idea actually. I may think about how to calculate the "error" signal from the wavelet transfrom.
- Elias
Hello!
That's great! Can you post the impulse response file of those, if you have measured them? I want to see how the 'worst' horn looks like! Let's nail that Honk
- Elias
Altec 511B. The 811B much less so with the same driver.
But I've heard worse....
That's great! Can you post the impulse response file of those, if you have measured them? I want to see how the 'worst' horn looks like!
Let's nail that Honk - Elias
Yes, well, sometimes the real life is more compilicated than textbook picture
It might be helpful to do a series of "honk granted" conical's (without any rounding whatsoever) – will see if I can provide measurements of a simple setup for say 0 60 120 180 deg included with the NEO driver ....
Should be fun to get those pix side by side...
Michael
Last edited:
Hello,
Where to find this information? I didn't find at diyaudio.
- Elias
Where to find this information? I didn't find at diyaudio.
- Elias
It may be instructive to look up Jack Bouska's analysis of XD125 on LHF.
3.5 kHz, I believe he said, but I forget the rationale.
Hello catapult,
Yes, that style of periodogram is very useful also but for another purpose.
I find out it's best suited to study loudspeaker-room effects at low frequencies.
See here for example:
http://www.diyaudio.com/forums/multi-way/145876-measured-monopole-dipole-room-responses.html
- Elias
Yes, that style of periodogram is very useful also but for another purpose.
I find out it's best suited to study loudspeaker-room effects at low frequencies.
See here for example:
http://www.diyaudio.com/forums/multi-way/145876-measured-monopole-dipole-room-responses.html
- Elias
ARTA uses wavelets for the Burst Decay sonograms but the time axis is in periods rather than ms.
Since you all want to make the Altec 811b the "Poster-Boy of Honk" / Have a gander at this ( from Zilch ) ;

The image is taken from this post within this thread ( over at LHF ) .
<> cheers
ps ; it would be nice if Pano would IR measure his 811b using some 802/902 drivers and then post the files here .
The image is taken from this post within this thread ( over at LHF ) .
<> cheers
ps ; it would be nice if Pano would IR measure his 811b using some 802/902 drivers and then post the files here .
Anyone want to walk me through creating the wavelet? I have several waveguides that I would love to run through it.
Like does it even work on Vista, downloaded and installed it.
The text based program came up and not anything gui...hmmm, reminds me of my unix days. (Hey, I remember ls type commands )
Like does it even work on Vista, downloaded and installed it.
The text based program came up and not anything gui...hmmm, reminds me of my unix days. (Hey, I remember ls type commands )
Last edited:
- Status
- This old topic is closed. If you want to reopen this topic, contact a moderator using the "Report Post" button.
- Home
- Loudspeakers
- Multi-Way
- Horn Honk $$ WANTED $$