BTW
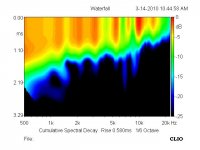
below are measurements of the ElectroVoice ST350 that's more or less the same braid ...

This pix was taken when investigating in an other topic - the measurements below were taken at usual ~ 1m distance in baffle of ~40cm / 15".
http://www.kinotechnik.edis.at/pages/diyaudio/GD_HighPass/EV_ST350/ST350_deg+0.pir
http://www.kinotechnik.edis.at/pages/diyaudio/GD_HighPass/EV_ST350/ST350_16bit.wav


To show the parallel of decay in discrete steps, CSD was performed over a too long time window – so past ~4ms the plots are compromised by room reflections to some extent.
Nevertheless, the typical decay in steps clearly can be seen ...
Something additional that sticks out is that the ripples in FR do not match that well the ripples in CSD later on in time – same behaviour also to be seen in your "normalized" plot:


How did you actually perform above "normalization" ?
")
Michael
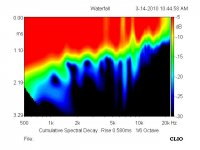
below are measurements of the ElectroVoice ST350 that's more or less the same braid ...
This pix was taken when investigating in an other topic - the measurements below were taken at usual ~ 1m distance in baffle of ~40cm / 15".
http://www.kinotechnik.edis.at/pages/diyaudio/GD_HighPass/EV_ST350/ST350_deg+0.pir
http://www.kinotechnik.edis.at/pages/diyaudio/GD_HighPass/EV_ST350/ST350_16bit.wav
To show the parallel of decay in discrete steps, CSD was performed over a too long time window – so past ~4ms the plots are compromised by room reflections to some extent.
Nevertheless, the typical decay in steps clearly can be seen ...
Something additional that sticks out is that the ripples in FR do not match that well the ripples in CSD later on in time – same behaviour also to be seen in your "normalized" plot:
How did you actually perform above "normalization" ?
Michael
Last edited:
FWIW, here is the ARTA sonogram from my 811-802D measurement.
Mine shows much more energy in the region of 1300Hz than yours does.
Hi Panomaniac,
(A) SONOGRAM : Mine or Zilches ? ( I get lost easily in these multi user threads )
(B) SALUTATIONS : Anyways, thanks ! for the measurements , they're much appreciated .
(C) IMPORTS : FWIW, ( contrary to your successful wave import into ARTA ) / my imports were only partially successful .
- ie ; I can't produce any CSDs or Burst Decay Plots for some reason ( likely because I'm a noob at swapping files between different programs
) .- The impulse is there and produces the expected FR & GD plots .
(D) COMMENTS : You're right , the 806 looks better than the 808-8D ( a symbiotic diaphragm in a 802D body ) . FWIW, if original, your driver is an oddball in the labelling department ( I've seen this before ) .
- I'd suggest that sometime you try putting the all aluminum diaphragm from your 806 into the 802 body . This will create a bona fide "old style" 802D .
<> cheers
Michael said:Something additional that sticks out is that the ripples in FR do not match that well the ripples in CSD later on in time – same behaviour also to be seen in your "normalized" plot:
How did you actually perform above "normalization" ?
- Those two plots were created by Zilch .
- You're right . The time decay smears don't track the FR that closely leading me to suspect reasons other than the driver ( horn ? , maybe the normalization process within CLIO ?, noise ? ) .
- I believe the "Normilization" in CLIO is created simply by selecting it as an option before producing the CSD / but / since I don't have CLIO, I'm just guessing .
Last edited:
I believe the "Normilization" in CLIO is created simply by selecting it as an option before producing the CSD / but / since I don't have CLIO, I'm just guessing
Are you talking Normalized to the 0db reference point?? If you are CLIO does that automatically. It takes the highest SPL point of the FR curve and Normalizes to that point. You can also manualy change the level in 5db steps up or down. Attached are the original load and the second with the reference point shifted up 5db. Look at the side scales
Rob
Attachments
Hey Earl. When I said "yours" it was the sonogram in post #177 I was referring to. Zilch did that one?
It does seem that interpreting all these various charts and measurements is going to be tricky. Not only are the test rigs different, but the way the software is used is very different. If we are going to use ARTA to generate graphs, perhaps we need to lay down some rules so that we are all doing it the same way.
About the 802-8D driver. I don't know if the symbiotic 'frams are original, maybe not. They also have loading caps behind the 'frams. Next week I'll have a set of 802s with light weight alu frams to play with. Will report back.
Soongsc, the pix was for another measurement and it was actually very revealing the way I did it (FR and CSD wasn't the topic back then)...
Earl, thanks – as I see parallel behaviour with measurements of mine that were *not* related to horns, but to direct radiators in different enclosures, I think we possibly see here the behaviour of two systems coupled. Luckily de-tuning those, might have been the reason that you got additional 12 dB in decay.
Its a pitty that transferring SPICE calculations to acoustic software is such a pain. I have to look if its easier with SoundEasy, that I just bought for the purpose, but first have to go through John Kreskovky's tutorial...
Rob, thanks for shading some light on Clio software, but the normalisation I'm after is not the way you show (auto-scaling).
What would be handy, is a normalization to 0dB at 0ms for *all* frequencies - thus leaving to be displayed *only* differences in decay.
Seems Zilch has done so – at least at 0ms there is the same SPL-color all the way
Michael
Last edited:
What would be handy, is a normalization to 0dB at 0ms for *all* frequencies - thus leaving to be displayed *only* differences in decay.
Seems Zilch has done so – at least at 0ms there is the same SPL-color all the way
Oh I understand. There is a Reference Button that you can activate that will do that normalization.
Rob
Attachments
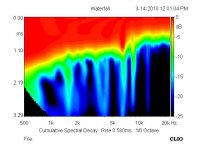
Pano said:Hey Earl. When I said "yours" it was the sonogram in post #177 I was referring to. Zilch did that one?
- Yes, Zilch produced all the CLIO measurements that I've posted in #177 ( his label "ZilchLab etc. etc. " is found in the top left corner ). Sorry for any confusion .
It does seem that interpreting all these various charts and measurements is going to be tricky. Not only are the test rigs different, but the way the software is used is very different. If we are going to use ARTA to generate graphs, perhaps we need to lay down some rules so that we are all doing it the same way.
- Yes, that makes sense ( display rules for ARTA ) .
- As a for instance, ARTAs Burst Decay when optimized for "Preferred Time Resolution" always shows an upwards drift of Frequency vs Time that I find very "offputting" / even deceiving .
- Here are two examples from Michaels' recent posts .


- If I can reasonably translate/transpose something that " I see to what I hear" then the DUT ( that these Decay plots belong to ) should "sharpen every note of the scale" upon playback . Since I don't believe that actually happens / plots like this I believe are an anomoly ( or gross exaggeration of some small signal behaviour ) .
- ie; I'd much rather that people use the "Preferred Frequency Resolution" option when displaying Burst Decay plots .
- I feel what's shown ( with Preferred Freq. Res. ) is closer to an audible reality ( for my senses ) .
About the 802-8D driver. I don't know if the symbiotic 'frams are original, maybe not. They also have loading caps behind the 'frams. Next week I'll have a set of 802s with light weight alu frams to play with. Will report back.
- I believe it was established that some 802-8D drivers shipped with symbiotics / though this was atypical .
- The more typical stock diaphragm for the 802-8D was the #21597 ( which you might have in your 806s / if they're the 8 ohm variety ) . My tests were made with a later diaphragm ( 35480 ) and with the loading cap in place . The 802-8D was never shipped with the 35480 diaphragm . I suspect ( no proof ) the 35480 is a more modern version of the 23744 "lightweight diaphragm" .
<> cheers
Last edited:
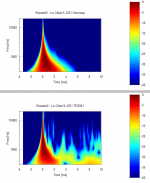
Hello Jean-Michel,
Here's the wavelet transforms for your horn, first the Hornresp simulated impulse response and second the one with TAD driver.
The Hornresp seemingly can predict the group delay quite correctly. But of course it does not give any indication of the horn internal/mouth diffraction/reflections, which are evident in the real measurement.
- Elias
You should compare with the theorical pulse response as calculated by Hornresp (here attached)
You'll find in attached file (in text format) as .wav (48kHz, 16 bits) the impulse reponse I measured on one of my horns (Fc = 320Hz, T = 0.707). The driver is the TAD TD2001.
Attachments
Hello Doug,
There is Octave support page can be found from link from here:
Octave
I didn't actually ever use the Octave forum But I know there are gurus in there!
- Elias
There is Octave support page can be found from link from here:
Octave
I didn't actually ever use the Octave forum
But I know there are gurus in there!- Elias
Elais, Is there forums for the Octave?
Oh I understand. There is a Reference Button that you can activate that will do that normalization.
Rob
Clever guys !
) .
- As a for instance, ARTAs Burst Decay when optimized for "Preferred Time Resolution" always shows an upwards drift of Frequency vs Time that I find very "offputting" / even deceiving .
Yeah - the really big problem tough is that we have not enough resolution in the area we are interested in regarding mouth reflection:

Actually we would like to investigate the time interval of ~ 1ms - and that one is displayed way more clearly by the wavelet analysis performed by Elias and can not be traced down by burst decay analysis in current ARTA version.
Bottom line – ARTA does the wavlet analysis that seems to be superior to Fourier Analysis in this respect – but we also need the plot formatted in time axis rather than in periods as mouth reflection is kinda echo effect and thus dependant to time not to periods...
Lets hope Ivo Mantljan comes up with some additional tricks on next ARTA version
Michael
Last edited:
Elias said:There is Octave support page can be found from link from here:
Octave
I didn't actually ever use the Octave forum But I know there are gurus in there!
Thanks for that Elias !
Looks like great software .
<> cheers
I think we're always going to have those problems due to our (non-anechoic) measurement setups. For example, Michael has said his measurements have problems around 4ms and, sure enough, there's a band that 'creeps' from 4 periods at 1K to 8 periods at 2K, etc. I wouldn't want to read anything about the horn's behavior into that.As a for instance, ARTAs Burst Decay when optimized for "Preferred Time Resolution" always shows an upwards drift of Frequency vs Time that I find very "offputting" / even deceiving .
- Here are two examples from Michaels' recent posts .
I think we're always going to have those problems due to our (non-anechoic) measurement setups. For example, Michael has said his measurements have problems around 4ms and, sure enough, there's a band that 'creeps' from 4 periods at 1K to 8 periods at 2K, etc. I wouldn't want to read anything about the horn's behavior into that.
Well - I could do outdoor measurements - once we have less snow around here
- might be we need that even for horns of, say ~ 200mm / 8 " depth - but I doubt.Time of flight for the echo (back and forth again) would be roughly 40cm / 32" in addition - making up for only ~1.2ms delay .....
Should do within the 4ms gating limit - no ?
Michael
Thanks ! Michael for all the ST350 info .
I've never seen it published as an ARTA file before .
You are welcome - if you have special interest in this horn, here are some polars (smoothed to 1/3 octave)
http://www.diyaudio.com/forums/multi-way/103872-geddes-waveguides-80.html#post2093299
I did an active speaker for a keyboarder, once this horn was rather new - luckily it survived...
Michael
Last edited:
In my setup the first reflections is at about 5.5mS. It's not huge, but it's there. Not a big deal as I start the sweep at 220 or 250Hz. Gating the measurement just before the 1st reflection means gating at >200Hz.
Just FWIW and for fun. I was banging on my 511 horn today and looking at the resonance. It's right at 710Hz, very pure. Loooong decay. But you know what? I don't see it on the FR, distortion, CSD or burst charts? ??? Will do more looking.
Just FWIW and for fun. I was banging on my 511 horn today and looking at the resonance. It's right at 710Hz, very pure. Loooong decay. But you know what? I don't see it on the FR, distortion, CSD or burst charts? ??? Will do more looking.
- Status
- This old topic is closed. If you want to reopen this topic, contact a moderator using the "Report Post" button.
- Home
- Loudspeakers
- Multi-Way
- Horn Honk $$ WANTED $$