Hi,
Can someone help me with a model of the E80F please?
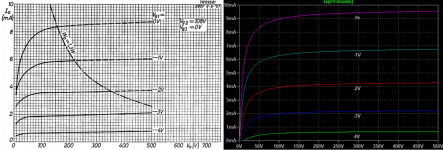
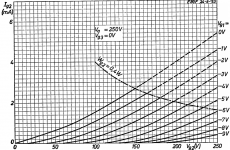
Strangely, the only datasheet I can find doesn't seem to contain any triode-strapped curves. There are 2 sets of pentode curves but multiple sets of curves for Ia vs Ig1 for different values of Vg2.
I might have to put some on my curve tracer and produce some triode-strapped curves like that.
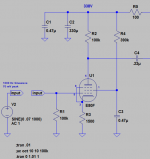
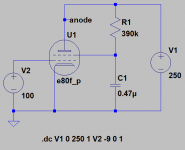
Datasheet and portion of LTSpice circuit attached.
Thanks.
Can someone help me with a model of the E80F please?
Strangely, the only datasheet I can find doesn't seem to contain any triode-strapped curves. There are 2 sets of pentode curves but multiple sets of curves for Ia vs Ig1 for different values of Vg2.
I might have to put some on my curve tracer and produce some triode-strapped curves like that.
Datasheet and portion of LTSpice circuit attached.
Thanks.
Attachments
I do not know if is working I find it on Yahoo Ltspice group
*SRC=E80F;E80F;Lampes;Sign.Pentode;Low Noise 2W
*SYM=PENTHODE
.SUBCKT E80F 1 2 3 4
* Anode G2 G1 Cathode
X1 1 2 3 4 PENTH1 G=.913m MU=140000 MU12=22.38 k1=20.34 k2=20.7 k3=.6
+k4=25.67 k5=26.4 k6=15 K=.206m
X2 3 4 Igrid ALPHA=.02m BETA=.1U
C2 1 4 5.5P
C3 3 1 .05P
C5 3 4 4P
.ENDS
here from other source:
.SUBCKT E80F 1 2 3 4
* Anode G2 G1 Cathode
X1 1 2 3 4 PENTH1 G=.913m MU=140000 MU12=22.38 k1=20.34 k2=20.7 k3=.6 k4=25.67 k5=26.4 k6=15 K=.206m
X2 3 4 Igrid ALPHA=.02m BETA=.1U
C2 1 4 5.5P
C3 3 1 .05P
C5 3 4 4P
RF1 1 4 200MEG
RF2 3 4 50MEG
RF3 2 4 100MEG
.ENDS
all the best
Last edited:
I do not know if is working...
Thanks for these. Now, I suppose this is basic but why do I get "Undefined subcircuit: penth1"?
You also need the penth1 and Igrid sub-circuits to make the model work. BTW, the two models shown are the same...Thanks for these. Now, I suppose this is basic but why do I get "Undefined subcircuit: penth1"?
[EDIT] Found it!
Code:
.SUBCKT PENTH1 A G2 G1 C

* Terme d'ecran
B1 10 0 V=IF(V(A,C)>0,(V(G2,C)/{MU12})*(V(A,C)-({k3}*V(G1,C)))/((V(G2,C)/{k1})+V(A,C)),0)

* Total
B2 A C I={G}*((V(G1,C)+V(10,0))+(V(A,C)/({MU}*(1-(V(G1,C)/{k2})))))**1.5

* Calcul du courant d'ecran
B6 12 0 V=IF(V(G2,C)>0,(V(G1,C)+(V(G2,C)/{k4})),0)
B7 G2 C I={K}*(V(12,0)**1.5)*((V(A,C)+{k5})/(V(A,C)+{k6}))**3
.ENDS

******************
.SUBCKT Igrid G1 C
* Courant grille
B4 6 0 V=IF(V(G1,C)>0,{ALPHA}*V(G1,C)**1.5,{BETA}/-(V(G1,C)-.1))
B5 G1 C I=V(6,0)
.ENDS

******************
.SUBCKT VALVE1 A1 A2 C
B1 1 0 V=IF(V(A1,C)>0,{G}*(V(A1,C)),0)
B2 2 0 V=IF(V(A2,C)>0,{G}*(V(A2,C)),0)
B3 A1 C I=V(1,0)**1.5
B4 A2 C I=V(2,0)**1.5
R1 C 0 1MEG
.ENDSThanks for these. Now, I suppose this is basic but why do I get "Undefined subcircuit: penth1"?
Pentode does not work so I quick design your partial circuit using the tetrode model and the additional sub-circuits suggested by Jazbo8 and now is working, here .asc file so you can easy check it...all the best
Attachments
Pentode does not work so I quick design your partial circuit using the tetrode model and the additional sub-circuits suggested by Jazbo8 and now is working, here .asc file so you can easy check it...all the best
Thanks very much to you both for that.
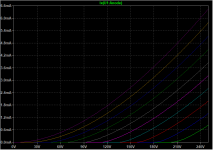
I've attached the pentode curves and you can see they're a pretty good match.
I tried to get some triode curvers, even though there's nothing in the datasheet to compare them with, but the result wasn't great. Is that a limitation of the tube model?
I'll plug the model into my amp simulation and see how it goes.
Attachments
Thanks very much to you both for that.
I've attached the pentode curves and you can see they're a pretty good match.
I tried to get some triode curvers, even though there's nothing in the datasheet to compare them with, but the result wasn't great. Is that a limitation of the tube model?
I'll plug the model into my amp simulation and see how it goes.
but in the triode mode you have to connect A and G2 together without R1 390k
Your ef80f pentode post #1950 the Ia is about 1ma higher than the original, hence the triode plot is a little steeper. Here is my paint model:
Code:
**** E80F_P ******************************************
* Created on 02/20/2019 14:29 using paint_kip.jar
* [URL="http://www.dmitrynizh.com/tubeparams_image.htm"]Model Paint Tools: Trace Tube Parameters over Plate Curves, Interactively[/URL]
* Plate Curves image file: e80f_p.png
* Data source link: <plate curves URL>
*----------------------------------------------------------------------------------
.SUBCKT E80F_P P G2 G K ; LTSpice tetrode.asy pinout
* .SUBCKT E80F_P P G K G2 ; Koren Pentode Pspice pinout
+ PARAMS: MU=23.26 KG1=2830.31 KP=1321.18 KVB=0 VCT=0 EX=1.355 KG2=2186.46 KNEE=14.61 KVC=1.588
+ KLAM=3.702E-9 KLAMG=1.221E-6   KNK=-0.044 KNG=0.006 KNPL=50 KNSL=11 KNPR=120 KNSR=29
+ CCG=5P CGP=0.025P CCP=7.3P RGI=2000.0
* Vp_MAX=500 Ip_MAX=10 Vg_step=2 Vg_start=0 Vg_count=11
* X_MIN=56 Y_MIN=41 X_SIZE=767 Y_SIZE=763 FSZ_X=1550 FSZ_Y=878 XYGrid=false
* Rp=1400 Vg_ac=20 P_max=1.3 Vg_qui=-10 Vp_qui=300
* showLoadLine=n showIp=y isDHP=n isPP=n isAsymPP=n isUL=n showDissipLimit=y
* showIg1=n isInputSnapped=y addLocalNFB=n
* XYProjections=n harmonicPlot=y dissipPlot=n
* UL=0.43 EG2=108 gridLevel2=n addKink=y isTanhKnee=n advSigmoid=n
*----------------------------------------------------------------------------------
RE1  7 0  1G    ; DUMMY SO NODE 7 HAS 2 CONNECTIONS
E1   7 0  VALUE=  ; E1 BREAKS UP LONG EQUATION FOR G1.
+{V(G2,K)/KP*LOG(1+EXP((1/MU+(VCT+V(G,K))/SQRT(KVB+V(G2,K)*V(G2,K)))*KP))}
RE2  6 0  1G    ; DUMMY SO NODE 6 HAS 2 CONNECTIONS
E2  6 0  VALUE={(PWR(V(7),EX)+PWRS(V(7),EX))} ; Kg1 times KIT current
RE21 21 0 1
E21  21 0 VALUE={V(6)/KG1*ATAN(V(P,K)/KNEE)} ; Ip with knee but no slope and no kink
RE22 22 0 1 ; E22: kink curr deviation for plate
E22  22 0 VALUE={V(21)*LIMIT(KNK-V(G,K)*KNG,0,0.3)*(-ATAN((V(P,K)-KNPL)/KNSL)+ATAN((V(P,K)-KNPR)/KNSR))}
G1   P  K  VALUE={V(21)*(1+KLAMG*V(P,K))+KLAM*V(P,K) + V(22)}
* Alexander Gurskii screen current, see audioXpress 2/2011, with slope and kink added
RE43 43 K 1G ; Dummy
E43  43 G2 VALUE={0} ; Dummy
G2   43 K  VALUE={V(6)/KG2*(KVC-ATAN(V(P,K)/KNEE))/(1+KLAMG*V(P,K))-V(22)}
RCP  P K  1G     ; FOR CONVERGENCE
C1   K G  {CCG}  ; CATHODE-GRID 1
C2   G P  {CGP}  ; GRID 1-PLATE
C3   K P  {CCP}  ; CATHODE-PLATE
R1   G 5  {RGI}  ; FOR GRID CURRENT
D3   5 K  DX     ; FOR GRID CURRENT }
.MODEL DX D(IS=1N RS=1 CJO=10PF TT=1N)
.ENDS
*$


* The following triode model is derived from pentode model, see above.
* In the triode model, all spice parameters come directly from the pentode model, except for Kg1,
* which for triode-strapped pentodes is derived from pentode's Kg1, Kg2 and Kvc as
*
*    4Kg1Kg2 / ((2Kvc-Pi)(2Kg1+PiKg2))

**** E80F_P ******************************************
* Created on 02/20/2019 14:29 using paint_kit.jar 4.7
* [URL="http://www.dmitrynizh.com/tubeparams_image.htm"]Model Paint Tools: Trace Tube Parameters over Plate Curves, Interactively[/URL]
* Plate Curves image file: e80f_p.png
* Data source link: <plate curves URL>
*----------------------------------------------------------------------------------
.SUBCKT TRIODE_E80F_P 1 2 3 ; Plate Grid Cathode
+ PARAMS: CCG=5P  CGP=0.025P CCP=7.3P RGI=2000
+ MU=23.26 KG1=57430.13 KP=1321.18 KVB=0 VCT=0 EX=1.355
* Vp_MAX=500 Ip_MAX=10 Vg_step=2 Vg_start=0 Vg_count=11
* Rp=1400 Vg_ac=20 P_max=1.3 Vg_qui=-10 Vp_qui=300
* X_MIN=56 Y_MIN=41 X_SIZE=767 Y_SIZE=763 FSZ_X=1550 FSZ_Y=878 XYGrid=false
* showLoadLine=n showIp=y isDHT=n isPP=n isAsymPP=n showDissipLimit=y
* showIg1=n gridLevel2=n isInputSnapped=y
* XYProjections=n harmonicPlot=y dissipPlot=n
*----------------------------------------------------------------------------------
E1 7 0 VALUE={V(1,3)/KP*LOG(1+EXP(KP*(1/MU+(VCT+V(2,3))/SQRT(KVB+V(1,3)*V(1,3)))))}
RE1 7 0 1G  ; TO AVOID FLOATING NODES
G1 1 3 VALUE={(PWR(V(7),EX)+PWRS(V(7),EX))/KG1}
RCP 1 3 1G   ; TO AVOID FLOATING NODES
C1 2 3 {CCG} ; CATHODE-GRID
C2 2 1 {CGP} ; GRID=PLATE
C3 1 3 {CCP} ; CATHODE-PLATE
D3 5 3 DX ; POSITIVE GRID CURRENT
R1 2 5 {RGI} ; POSITIVE GRID CURRENT
.MODEL DX D(IS=1N RS=1 CJO=10PF TT=1N)
.ENDS
*$
Attachments
Thanks again. Now I get
Can't find definition of model "RGI"
when I click OK to continue I get
u1:e1: -- Syntax Error -- Unknown symbol: kp
I see there are 4 instances of "RGI" with the first in line 18.
Does the full text of your model with both pentode and triode models go into the Spice directive?
Can't find definition of model "RGI"
when I click OK to continue I get
u1:e1: -- Syntax Error -- Unknown symbol: kp
I see there are 4 instances of "RGI" with the first in line 18.
Does the full text of your model with both pentode and triode models go into the Spice directive?
Pentode and triode model is combined in one directive, each has it's own begin and end so no problem with that. You can cut off the text of triode section however if not used. Btw, the model is working as is when I cut and paste from the code windows I posted. Try the asc file attached see it working now for you. It may be different version of LTSpice, reinstall the latest version may help, or the Windows version maybe an issue, I use Win10. Be careful when editing the file, not begin text in isolation as it must be a complete line according to the syntax.
Attachments
Last edited:
Try the asc file attached
Thanks. I took that file and added your model. It worked fine.
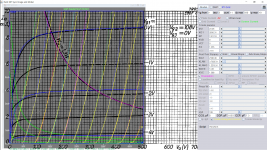
So I then modified that model so I could get the triode curves. They're pretty close.
No idea what was wrong with my original model.
Attachments
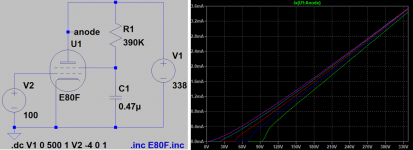
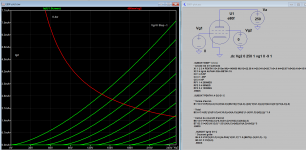
Again, the tube is not connected as a triode, the chart shows Ig2 not Ip.
Thanks. I now understand the first point and should have looked more closely at the chart axes.

That screen current g2 plot is very useful but I somehow missing it. The Yahoo bbs version is closer than mine in term of Ig2 so I need to readjust it and post soon. But that is indeed the triode curve of g2 but not the Ia +Ig2.
Attachments
Last edited:
Hi. How do you put the 400mW max g2 dissipation curve on there?
After you plot the first curve, you right click on waveform window and select "Add a traces to the plot", in the "Expression(s) to add" enter "400mw/Vg2", then unchecked "Auto Range". Sometimes the plot got messed up you need to click on the waveform screen, in "View", the "Manual Limit" for vertical and horizontal limits.
Hi. How do you put the 400mW max g2 dissipation curve on there?
you can also have the load line and more watch this YouTube
you can also have the load line and more watch this YouTube
Thanks. I'll try all that.
- Status
- This old topic is closed. If you want to reopen this topic, contact a moderator using the "Report Post" button.
- Home
- Amplifiers
- Tubes / Valves
- E80F SPICE models