In a recent thread about the questionable relevance of fussing over phase (or even polarity) in the bass in real-world rooms, esp regarding OB bass, I was treated to some well-intentioned advice about how to set the EQ in my DSP to make the terrible FR into something nice.
https://www.diyaudio.com/forums/subwoofers/339121-subs-reversed-polarity-surprise.html#post5823511
Now in the other thread for purposes of demonstration, I just plunked down my mic in a convenient centre-line spot and did all the tests in that single accidental location without fishing for some place to make my point by selecting a better spot. The well-intentioned person noted deficiencies in the FR for that accidental location and offered advice to make my room FR right.
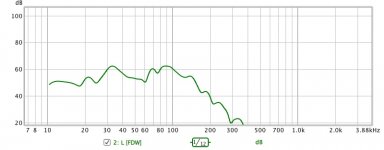
The purpose of this thread is to show how much REW mic FR results for subwoofers vary with mic location. Also and of course never my primary motivation, to show how quite wonderful (and super wonderful in the super-low bass) was my EQ when measured where my head stays when listening to music in my chair.
However, just as I demonstrate that anybody with a DSP can cook up great FR at their chair, it is equally true that everywhere else it might be quite deficient. I do my EQ fine-tuning by averaging three mic locations, which helps by averaging it a bit at least in that vicinity.
Because the chair results (esp the both plots) are so dramatically nicer than the accidental location, I think my point is best made with individual plots, not same-plot comparisons.
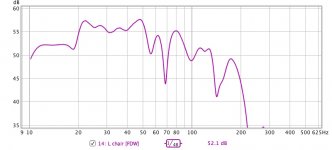
1. L accidental
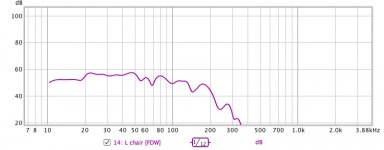
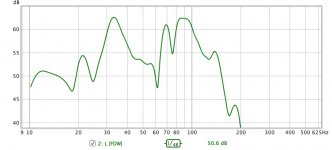
2. L chair
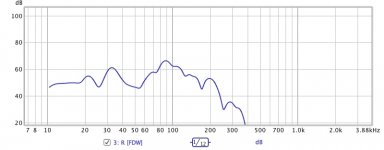
3. R accidental
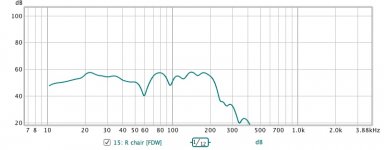
4. R chair
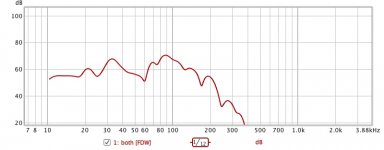
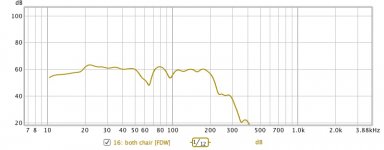
5. both accidental
6. both chair
B.
https://www.diyaudio.com/forums/subwoofers/339121-subs-reversed-polarity-surprise.html#post5823511
Now in the other thread for purposes of demonstration, I just plunked down my mic in a convenient centre-line spot and did all the tests in that single accidental location without fishing for some place to make my point by selecting a better spot. The well-intentioned person noted deficiencies in the FR for that accidental location and offered advice to make my room FR right.
The purpose of this thread is to show how much REW mic FR results for subwoofers vary with mic location. Also and of course never my primary motivation, to show how quite wonderful (and super wonderful in the super-low bass) was my EQ when measured where my head stays when listening to music in my chair.
However, just as I demonstrate that anybody with a DSP can cook up great FR at their chair, it is equally true that everywhere else it might be quite deficient. I do my EQ fine-tuning by averaging three mic locations, which helps by averaging it a bit at least in that vicinity.
Because the chair results (esp the both plots) are so dramatically nicer than the accidental location, I think my point is best made with individual plots, not same-plot comparisons.
1. L accidental
2. L chair
3. R accidental
4. R chair
5. both accidental
6. both chair
B.
Attachments
Last edited:
I am unsure why this is such a surprise...
Rooms completely screw up the frequency response. If you live in a house with a decent sized yard take your speakers outside and have a listen.... and measure them.
Rooms completely screw up the frequency response. If you live in a house with a decent sized yard take your speakers outside and have a listen.... and measure them.
Ben,
With graphs of 20dB/div, it's very difficult to see what's going on - anything looks flat with those scales. Try 5dB/div and we can see what's what.
Chris
With graphs of 20dB/div, it's very difficult to see what's going on - anything looks flat with those scales. Try 5dB/div and we can see what's what.
Isn't that the same as asking to paint an "11" on the volume control knob panel?
A person with experience studying such data would have known to ask for a different smoothing algorithm.
Or a magnifying glass.
All I meant to show is that mic location matters a whole lot, whether the system is EQ'd or not. That thought is widely held, of course, but not widely seen as simple comparison plots, as I have posted. So much jaw-jaw in this forum and so little data-data.
B.
Last edited:
Isn't that the same as asking to paint an "11" on the volume control knob panel?
No.
A person with experience studying such data would have known to ask for a different smoothing algorithm.
Or a magnifying glass.
All I meant to show is that mic location matters a whole lot, whether the system is EQ'd or not. That thought is widely held, of course, but not widely seen as simple comparison plots, as I have posted. So much jaw-jaw in this forum and so little data-data.
B.
I spent a good few years in a lab while I was getting my Physics degree. The heavy theoretical stuff wasn't for me, so I did a lot of practical work followed by an awful lot of data analysis.
The smoothing is fine. The compressed axes mean the curves aren't shown particularly well.
I appreciate you taking the time to measure these things.
Chris
Try using a 10-300Hz range, no smoothing and setting the SPL limits to a range of 50dB total. Smoothing isn't needed under 200Hz. This will make the measurements look a LOT uglier but the goal of measurements is to learn from them and use them as tools, not to win beauty contests.
Try using a 10-300Hz range, no smoothing and setting the SPL limits to a range of 50dB total. Smoothing isn't needed under 200Hz.
All I meant to show is that mic location matters a whole lot and to roughly illustrate the large scale of that influence. That point is made perfectly clear from glancing at the tiny thumbnails. Anyone who wants to dispute that should post their own data. Likewise for the other thread about polarity and phase.
Just what does anyone expect to learn by magnifying the scale that you couldn't learn by enlarging the picture on your screen for exactly the same result? Same illogic as "paint '11' on the dial".
chris661 - as I said earlier, smoothing is another matter - at least above 100 or 200 Hz, and exactly as Josh Ricci correctly says (as would be expected from Josh Ricci). Because below 100 Hz, the 1/12 smoothing that I routinely use and "no smoothing" are almost identical. (Which is why I use 1/12 as a standard since rarely is anything is gained by less smoothing or by more smoothing anywhere in the FR.)
B.
Last edited:
I wouldn't want to frustrate all the readers who keenly await learning new insights from those who have asked for no-smoothing (AKA 1/48 in REW) and scale magnification.
Here I have changed the view of the previously posted L sub in two locations from post #1 - since I haven't figured out how to get REW to put them into the same illustration.
New insights?
B.
Here I have changed the view of the previously posted L sub in two locations from post #1 - since I haven't figured out how to get REW to put them into the same illustration.
New insights?
B.
Attachments
Last edited:
They look OUCH!!!!!
But then you can´t argue reality ... at the exact point where those mikes were situated that is.
Move them a foot or two and curves will change completely.
I thank bentoronto for actually measuring and posting; at the same time I hope he realizes those graphs do not mean that they apply everywhere inside that room.
Rooms are tricky.
EDIT: in any case the "chair" graph looks incredibly smooth , so I´d just sit there and enjoy 😀
Last edited:
Just hold on a moment, JMFahey (who I greatly respect).They look OUCH!!!!!....EDIT: in any case the "chair" graph looks incredibly smooth , so I´d just sit there and enjoy 😀
Seems that unlike chris661 you aren't to be susceptible to optical illusions since the second plot is identical to post #1 but magnified. Or, just sticking to numbers instead of magnified illusions for a moment, the first plot is in an accidental location to prove a point while the second plot is my chair.
Hope everybody agrees that EVEN unsmoothed, the chair FR is nearly all within plus or minus 5 dB from 10 Hz all the way to the crossover point. Same as post #1. A bit better and prolly more truthful with a bit of smoothing.
If anybody has a better plot at their chair, let them post it for all to admire.
As JMFahey points out, EQ works for one spot and fingers-crossed elsewhere. I try to use the REW average, taking 3 readings within a foot of my head. But makes no sense to go too far or use too many EQs and, of course, don't sweat the dips.
B.
- Status
- Not open for further replies.
- Home
- Loudspeakers
- Subwoofers
- I moved mic position - OMG