I continue to prod and poke at a class A/B amplifier, in the form of a simulated Rotel RB850;
Simulating Rotel RB850 in LTSpice?
I have set things up with separate power rails to the front and and driver sections, and can inject ripple into either, checking the PSRR of both (or, put another way, how much the output drivers could corrupt the sensitive front end via the power rails).
However.
I initially tried the amp with clean power rails (and since this is a simulation, clean means perfectly clean)
I was following the notes on this page;
Distortion measurements with LTSPICE | Audio Perfection
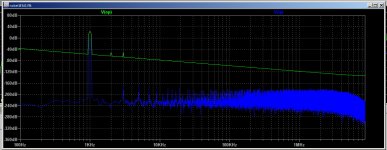
Now, the FFT graph (and numbers) of the input (ip) are a good match for the weblink, indicating that my simulation and FFT commands are behaving sensibly.
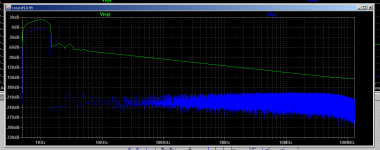
But the output (op) graph is weird. There are some 1Khz components, and some obvious harmonics (that's good, the input is 1khz...), but there appears to be substantial signal content at literally every frequency, dropping off at 20dB per decade, like a first order filter (the basic sloping line)
I attach the LTSpice file, the output FFT, and the FFT numbers.
Is my circuit horribly weird, or am I misinterpreting my FFT (or "other")?
BugBear
Simulating Rotel RB850 in LTSpice?
I have set things up with separate power rails to the front and and driver sections, and can inject ripple into either, checking the PSRR of both (or, put another way, how much the output drivers could corrupt the sensitive front end via the power rails).
However.
I initially tried the amp with clean power rails (and since this is a simulation, clean means perfectly clean)
I was following the notes on this page;
Distortion measurements with LTSPICE | Audio Perfection
Now, the FFT graph (and numbers) of the input (ip) are a good match for the weblink, indicating that my simulation and FFT commands are behaving sensibly.
But the output (op) graph is weird. There are some 1Khz components, and some obvious harmonics (that's good, the input is 1khz...), but there appears to be substantial signal content at literally every frequency, dropping off at 20dB per decade, like a first order filter (the basic sloping line)
I attach the LTSpice file, the output FFT, and the FFT numbers.
Is my circuit horribly weird, or am I misinterpreting my FFT (or "other")?
BugBear
Attachments
Last edited:
You need to force the time steps to be the samples for the FFT otherwise the transient analysis can interpolate causing this effect.
.param num_cycles 20
.param num_fft_pts 2048
.param freq 1000
.param timestep {1/((num_fft_pts-1)*freq)}
.tran 0 {(num_cycles+1)/freq} {1/freq} {timestep}
.param num_cycles 20
.param num_fft_pts 2048
.param freq 1000
.param timestep {1/((num_fft_pts-1)*freq)}
.tran 0 {(num_cycles+1)/freq} {1/freq} {timestep}
Well, that sounded very plausible, so I set it all up.You need to force the time steps to be the samples for the FFT otherwise the transient analysis can interpolate causing this effect.
.param num_cycles 20
.param num_fft_pts 2048
.param freq 1000
.param timestep {1/((num_fft_pts-1)*freq)}
.tran 0 {(num_cycles+1)/freq} {1/freq} {timestep}
The FFT plot is unchanged. 🙁
BugBear
Be sure any compression is turned off.Well, that sounded very plausible, so I set it all up.
The FFT plot is unchanged. 🙁
BugBear
Be sure any compression is turned off.
Per the .asc file I attached my post, and the weblink I posted;
"After disabling compression and restoring max timestep to original 1uS the simulation looks like:
.
.
.
The main drawback of disabling compression through control panel is that you have to do this every time you are restarting LTSPICE.
More convenient way is to add .OPTIONS plotwinsize=0 to your LTSPICE schematic.
"
BugBear
Had a quick peek, but you've not included your 'discrete models file' so I couldn't run it.
That kind of sloping baseline might well be a function of having a significant DC offset at the output - worth trying AC coupling to a node which you then FFT.
If its not fixed by nulling out any offset then look at whether you have an integer number of cycles of your stimulus sinewave to FFT. If not then there will be 'leakage' which you can often fix with a suitable windowing function. 'No window' really means a rectangular shaped one.
Last edited:
Well, that sounded very plausible, so I set it all up.
The FFT plot is unchanged. 🙁
Sorry LTspice is not my usual simulator, I have a command that does this automatically. There is an LTspice thread where I'm sure someone can help.
Had a quick peek, but you've not included your 'discrete models file' so I couldn't run it.
That kind of sloping baseline might well be a function of having a significant DC offset at the output - worth trying AC coupling to a node which you then FFT.
If its not fixed by nulling out any offset then look at whether you have an integer number of cycles of your stimulus sinewave to FFT. If not then there will be 'leakage' which you can often fix with a suitable windowing function. 'No window' really means a rectangular shaped one.
Sorry - I had a duff link in my 1st post; it now links to my original thread, where Mooly in post #4 provided a file with the models I needed and used.
I have tried to get rid of the DC offset by adding a large capacitor (OK, very large, this is LTSpice, I don't have to pay for all those Farads...) to the op, and sampling on the other side of it.
The reported DC offset in the FFT remains. Which is very surprising to me.
BugBear
I had no FFT windowing selected (as per my guide page.
Distortion measurements with LTSPICE | Audio Perfection
)
This appears to make a big difference, although I'm not sure what the difference is, or what windowing is "good".
BugBear
Distortion measurements with LTSPICE | Audio Perfection
)
This appears to make a big difference, although I'm not sure what the difference is, or what windowing is "good".
BugBear
Hmm. I think I need to do some general reading up about FFT.
It's becoming obvious I have no clue what the parameters I'm bashing at actually mean.
BugBear
It's becoming obvious I have no clue what the parameters I'm bashing at actually mean.
BugBear
OK; I have managed to get a FFT I consider plausibly meaningful.
It looks like there's some kind of quite slow (around a second) settling in process somewhere in the circuit.
By running the sim for a whole second, but only sampling in the last 15 ms, even the DC coupled output gives a plausible result.
Since I'm running with a small (100n) max time interval, this takes a long time to simulate.
There is still much I don't understand, but this seems to be progress, albeit halting.
FFT and model file attached.
BugBear
Attachments
You need to force the time steps to be the samples for the FFT otherwise the transient analysis can interpolate causing this effect.
.param num_cycles 20
.param num_fft_pts 2048
.param freq 1000
.param timestep {1/((num_fft_pts-1)*freq)}
.tran 0 {(num_cycles+1)/freq} {1/freq} {timestep}
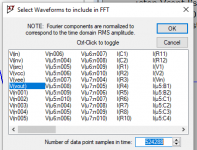
You also have to set the FFT points in the FFT trace selection window to the same number of points as you specified, and the timestep to the correct value.
I am using the attached which is equivalent to your stuff Scott, and then set the FFT data points to 0.5M see attached.
Also set the AC source freq to {freq}!
dlycyc and numcyc are the number of cycles to wait to start logging data and the number of cycles over which the FFT is done.
Jan
Jan
Attachments
Last edited:
I modified my model/simulation to use this approach, but the FFT reverted to that of my initial post.You also have to set the FFT points in the FFT trace selection window to the same number of points as you specified, and the timestep to the correct value.
I am using the attached which is equivalent to your stuff Scott, and then set the FFT data points to 0.5M see attached.
Also set the AC source freq to {freq}!
dlycyc and numcyc are the number of cycles to wait to start logging data and the number of cycles over which the FFT is done.
Jan
Jan
BugBear
Attachments
Last edited:
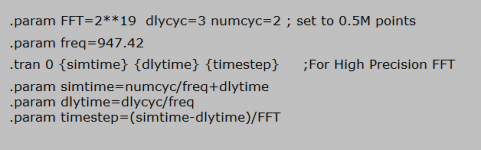
Here's what I used:
Code:
.options plotwinsize=0
.options numdgt=7
Code:
.param input=1
.param freq=1k
.param numcyc=40
.param dlycyc=20
.param FFT=2**18
.param simtime=(dlycyc+numcyc)/Freq
.param dlytime=dlycyc/Freq
.param numsampl=simtime/Freq/((simtime/numcyc)*FFT)
.four {Freq} V(op)
.tran 0 {simtime} {dlytime} {numsampl}
Attachments

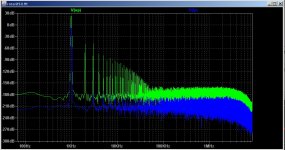
Interesting problem. It seems to be a windowing issue and a very slight phase lead at the pure_ac_op node makes it worse (I added a loading resistor). A ~5uS delay in the input source or 5uS start time for the FFT makes an improvement but better is to use a "Blackman" window and compare V(op) to V(ip)*22.
This simulation file has the models included:
This simulation file has the models included:
Attachments
I modified my model/simulation to use this approach, but the FFT reverted to that of my initial post.
BugBear
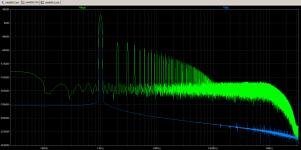
Well the blue curve (input signal?) seems quite alright, so the method looks fine.
It may be that the FFT accurately reports the actual output signal.
Jan
- Status
- Not open for further replies.
- Home
- Design & Build
- Software Tools
- FFT mystery?