“A Concise Model for Static Induction Transistor IV Characteristics” - Michael Rothacher
In his publication, a equation is given to find model for simulation:
Id=K*(Vg+Vct+N*LN(Vd)+Vd/Mu)^X
.SUBCKT TFH51S D G S
+ PARAMS: K=0.157 MU=7.3 N=2.24 X=1.51 VCT=0.0
B1 D S I=K*PWR(URAMP((V(G,S)+VCT)+(N*LN(V(D,S))+(V(D,S)/MU))),X)
.ENDS TFH51S
In his publication, a equation is given to find model for simulation:
Id=K*(Vg+Vct+N*LN(Vd)+Vd/Mu)^X
.SUBCKT TFH51S D G S
+ PARAMS: K=0.157 MU=7.3 N=2.24 X=1.51 VCT=0.0
B1 D S I=K*PWR(URAMP((V(G,S)+VCT)+(N*LN(V(D,S))+(V(D,S)/MU))),X)
.ENDS TFH51S

Using Microsoft Excel Solver to Find a SIT Sim Model Parameters(5)
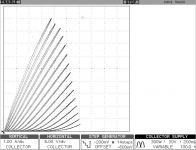
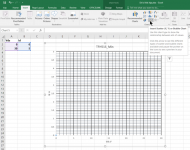
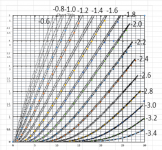
Step 3 Open an Excel worksheet, insert Scatter (X,Y), format Y axis Min 0, max 5, Major 0.5, Minor 0.1, format X axis Min 0, Max 30, Major 5, Minor 1, format major gridlines, add minor gridlines, format chart area No Fill, it becomes transparent
Step 3 Open an Excel worksheet, insert Scatter (X,Y), format Y axis Min 0, max 5, Major 0.5, Minor 0.1, format X axis Min 0, Max 30, Major 5, Minor 1, format major gridlines, add minor gridlines, format chart area No Fill, it becomes transparent
Attachments
Using Microsoft Excel Solver to Find a SIT Sim Model Parameters(7)
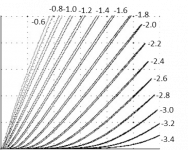
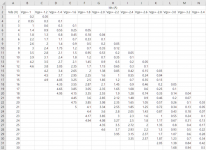
Step 5 Read Id value at every 1 Vds for each Vgs, using the picture created in Step 4. The major and minor grid lines help to do more easily and accurately. Input the data to the sheet as shown in photo.
Step 5 Read Id value at every 1 Vds for each Vgs, using the picture created in Step 4. The major and minor grid lines help to do more easily and accurately. Input the data to the sheet as shown in photo.
Attachments

Using Microsoft Excel Solver to Find a SIT Sim Model Parameters(8)
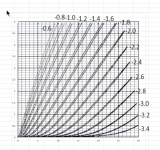
Step 6 Repeat Step 3 again but with the data. Make the exact size like before. Overlay the plot on top of the tracer curve. Now it the time to check if the value points match the curve. If not, modify the data to make the points fit the curves exactly.
Step 6 Repeat Step 3 again but with the data. Make the exact size like before. Overlay the plot on top of the tracer curve. Now it the time to check if the value points match the curve. If not, modify the data to make the points fit the curves exactly.
Attachments
Using Microsoft Excel Solver to Find a SIT Sim Model Parameters(10)
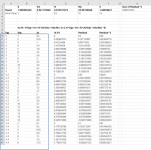
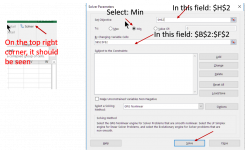
Step 8 Equations in Cell D10 (Id_Fit), E10 (Residual), F10 (Square Residual) and H2 (Sum of all Square Residual)
a. Copy the initial values into Results
b. In D10, input the equation exactly like this
=IF(A10+$C$2+$D$2*LN(B10)+B10/$E$2<0, 0, $B$2*(A10+$C$2+$D$2*LN(B10)+B10/$E$2)^$F$2)
c. In E10, input the equation exactly like this
=C10-D10
d. In F10, input the equation exactly like this
=E10^2
e. Mark D10, E10 and F10, copy, then Paste only function in all the cells below, Now all calculated values should be shown
f. Equation in Cell H2
=SUM(F10:F1000)
Using Microsoft Excel Solver to Find a SIT Sim Model Parameters(11)
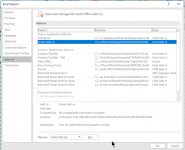
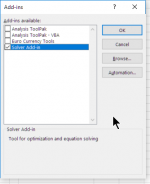
Step 9 Activate Microsoft Excel Solver Add-in (by default is not added in yet)
Pull down Menu: File -> Options -> Add-ins: Select or Highlight: Solver Add-in
Then: Manage: Excel Add-in , Go….., Check: Solver Add-in, OK
Step 9 Activate Microsoft Excel Solver Add-in (by default is not added in yet)
Pull down Menu: File -> Options -> Add-ins: Select or Highlight: Solver Add-in
Then: Manage: Excel Add-in , Go….., Check: Solver Add-in, OK
Attachments
Using Microsoft Excel Solver to Find a SIT Sim Model Parameters(13)
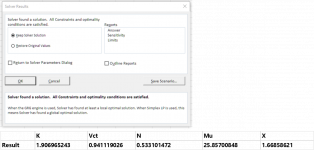
Step 11 Pop up and OK. Repeat Step 10 few times until the results not change anymore.
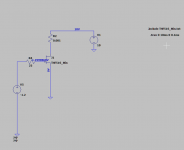
Open model, and change the parameters and save.
.SUBCKT TFH51S_Min D G S
+ PARAMS: K=1.91 MU=25.86 N=0.533 X=1.67 VCT=1.67
B1 D S I=K*PWR(URAMP((V(G,S)+VCT)+(N*LN(V(D,S))+(V(D,S)/MU))),X)
.ENDS TFH51S_Min
Step 11 Pop up and OK. Repeat Step 10 few times until the results not change anymore.
Open model, and change the parameters and save.
.SUBCKT TFH51S_Min D G S
+ PARAMS: K=1.91 MU=25.86 N=0.533 X=1.67 VCT=1.67
B1 D S I=K*PWR(URAMP((V(G,S)+VCT)+(N*LN(V(D,S))+(V(D,S)/MU))),X)
.ENDS TFH51S_Min
Attachments

Nice tutorial! Here's a little video I did on Excel a few years back in case its of use. 🙂
VLOG #1: Curve Tracer, Big VFET, SIT Modelling, Ironamp - YouTube
VLOG #1: Curve Tracer, Big VFET, SIT Modelling, Ironamp - YouTube


- Home
- Amplifiers
- Pass Labs
- Using Microsoft Excel Solver to Find a SIT Sim Model Parameters(1)