started bi-amping my 2 way bookshelfs, a pair of Athena s2
Athena Speaker System Page 2 | Sound & Vision
shows Freq response.
Now the strange part, I ran tones from 20 to 20k and measured the voltage at the drivers, post x-over. Instead of being flat till the x-over point both LF and HF are not flat at all. So do I recreate the strange x-over curves with my DSP or try something else? My gut tells me to recreate but Im an electronics guy not a speaker guy, so any input would be appreciated, thanks. my measurements and graphs next.
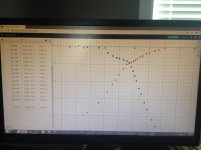
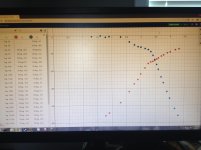
sorry wanted these graphs in other order and an x-axis that made sense, its actualy the log of frequency the only way i could do a log/semi log graph so on the x-axis 2 is 100hz, 3 is 1khz 4 is 10khz. The numbers on the left are my measurements in volts.The Y axis is db reference to 1 volt, the voltage I drove the speakers at when testing.The second graph shows the actual measurements. The first I added 6db to the tweeter to adjust the graph just for a better picture of the x-over point.
please let me know if I screwed up my measurements, my graphs, or my ideas.
please let me know if I screwed up my measurements, my graphs, or my ideas.
- Status
- Not open for further replies.