I would not expect ellipses. I would expect a straight line axis.
I failed to mention that my plots are pol->cart converted, R[phi,x];phi -> [x,y]
I created a spreadsheet to test the formula.
X is incremented in 5mm steps. Phi is incremented in pi/24 steps.
Three plots are made of the cross-section at the throat, the middle and the mouth.
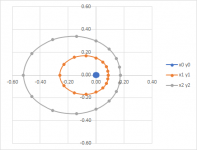
When Theta_min and Theta_max are equal it shows three concentric circles. As Theta_diff increases the circles become more elliptic and they are being offset to one side.
At first it looks like it works, but at some point they lose their elliptic shape and become something else.
Is this to be expected?
How about the center-axis? Is that supposed to also follow some curve, or should it be a straight line.
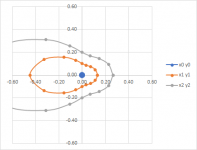
The dimple on the short angle axis concerns me as I would not expect that. How could a dimple occur from my equations?
The dimple on the short angle axis concerns me as I would not expect that. How could a dimple occur from my equations?
So the cross sections would always be circular but shifted according to the desired angle?
Near circular, but not precisely circles would be my expectation, kind of like egg shaped. But when I looked again those curves are for the 15 x 60 waveguide and at those extreme differences oddities might occur. If the average of the angles stayed at 90 then I would not expect anything but near circles. So 60 x 30 should be better.
Near circular, but not precisely circles would be my expectation, kind of like egg shaped. But when I looked again those curves are for the 15 x 60 waveguide and at those extreme differences oddities might occur. If the average of the angles stayed at 90 then I would not expect anything but near circles. So 60 x 30 should be better.
Something like this I suppose. It also looks more "natural" or not wrong 🙂
Attachments
Yes, that looks perfectly correct. Exactly what I would expect. They do appear to be egg shaped rather than elliptical, although they might be elliptical, I'm not sure.
Now try making the vertical different than either horizontal, but I suspect that it needs to be no narrower that the narrowest horizontal.
Now try making the vertical different than either horizontal, but I suspect that it needs to be no narrower that the narrowest horizontal.
Yes, that looks perfectly correct. Exactly what I would expect. They do appear to be egg shaped rather than elliptical, although they might be elliptical, I'm not sure.
Now try making the vertical different than either horizontal, but I suspect that it needs to be no narrower that the narrowest horizontal.
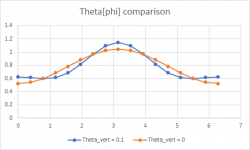
I'm fiddling a little bit with that, but I'm guessing how the other theta(phi) term should look like.
If I define it like: Theta[phi]= Theta_avg-COS(C12)*Theta_diff+COS(2*C12)*Theta_vert
When Theta_vert goes above 0.05Rad the curves get distorted
By looking at R[Phi,x] at a certain x value you can see the profile before it gets wrapped into cartesian space. The Cos(2*theta) term will cause a dip on either side of the center peak.
Attachments
I'm fiddling a little bit with that, but I'm guessing how the other theta(phi) term should look like.
If I define it like: Theta[phi]= Theta_avg-COS(C12)*Theta_diff+COS(2*C12)*Theta_vert
When Theta_vert goes above 0.05Rad the curves get distorted
By looking at R[Phi,x] at a certain x value you can see the profile before it gets wrapped into cartesian space. The Cos(2*theta) term will cause a dip on either side of the center peak.
C12 is Phi?
I'll have to think about this some more. Maybe its not so simple as I thought.
What would a plot of Theta(phi) look like?
C12 is Phi?
I'll have to think about this some more. Maybe its not so simple as I thought.
What would a plot of Theta(phi) look like?
C12 is phi, yes.
I plotted for two values of Theta_vert for the 30x60deg model
Attachments
Last edited:
Maybe Dick Small, who helped KEF "make our amplifiers twice as powerful" could be called into action? 😛...or if Danley can get this with a passive crossover I sure would like to see that! 😱
- Status
- Not open for further replies.
- Home
- Loudspeakers
- Multi-Way
- I Don't Understand.