Haven't figured out why this pic is upside down but life goes on!

Anyways, I've been hanging around the REW support forum on AVNirvana because I was assuming my 'strange' line array measurements were as result of me missing something on the steep REW learning curve. After poking around some more and continuing to read I'm starting to think my answers lie here. My first clue was reading Dr. Griffin paper where on page 5 he points out that nonlinear impulse responses are an inherent problem with line arrays.
Also, I came across another another possible great observation listed here,
Wave-front shape and impulse response: spherical, cylindrical, plane-wave
The quoted portion in bold speaks volumes to exactly what I'm experiencing!
All that said, I have a new MiniDSP 2x4HD and my goal continues to be 'enhancing' my listening experience with a few well chosen EQ filters and possibly some FIR filters.
The journey continues!
Regards,
Dan
Anyways, I've been hanging around the REW support forum on AVNirvana because I was assuming my 'strange' line array measurements were as result of me missing something on the steep REW learning curve. After poking around some more and continuing to read I'm starting to think my answers lie here. My first clue was reading Dr. Griffin paper where on page 5 he points out that nonlinear impulse responses are an inherent problem with line arrays.
Also, I came across another another possible great observation listed here,
Wave-front shape and impulse response: spherical, cylindrical, plane-wave
My experience is that it is very difficult to get accurate in-room measurements of the array. You simply see a lot of interference, which results in a smeared impulse response as well as a very ragged amplitude response with lots of peaks and dips. Move the mic just slightly and the response at higher frequencies tends to change a lot. What I do, is I take lots of measurements and average them. I EQ based on this average.
Earlier you said you could run some simulations. I'd love for you to do that. Would you please show the impulse response of a near-ideal array (with infinite or very long length and with densely packed point-sources), both with and without 3dB/oct. highpass? I'd also very much like to see what the effects of an increase in driver spacing are. I doubt he impulse response of a real-world line-array such as my own can be fixed by means of a simple high-pass filter.
The quoted portion in bold speaks volumes to exactly what I'm experiencing!
All that said, I have a new MiniDSP 2x4HD and my goal continues to be 'enhancing' my listening experience with a few well chosen EQ filters and possibly some FIR filters.
The journey continues!
Regards,
Dan
Attachments
Kuze3201 Line Array | Parts Express Project Gallery
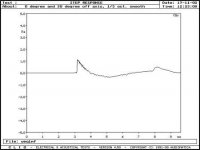
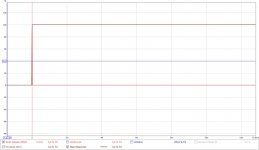
See the step response below of a 32 x 2" array.
See how jagged it is.
That may be what you are hearing.
Your impulse response though is making a lot of later noise.
1ms is around 1' if i remember correctly.
And here we go again.
See the step response below of a 32 x 2" array.
See how jagged it is.
That may be what you are hearing.
Your impulse response though is making a lot of later noise.
1ms is around 1' if i remember correctly.
And here we go again.
Attachments
Last edited:
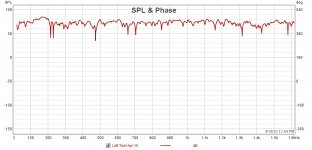
I'd recommend setting for a log scale and 3dB/div to get a better idea of what's happening. That frequency response graph shows very little.
Chris
Chris
More reading, more thoughts.
I'm going to take a hint from John Mulcahy and use 'average the responses' to get a good average of multiple measurements of each channel.
Then a page from wesayso's book and test some light EQing.
Some listening tests and go from there.
Regards,
Dan
I'm going to take a hint from John Mulcahy and use 'average the responses' to get a good average of multiple measurements of each channel.
Then a page from wesayso's book and test some light EQing.
Some listening tests and go from there.
Regards,
Dan
Then a page from wesayso's book and test some light EQing.
What book is that?
What book is that?
It's a figure of speech. I've been reading his thread The making of: The Two Towers (a 25 driver Full Range line array)
Regards,
Dan
And what do your ears tell you ?
Maybe this weekend.
Regards,
Dan
REW is not that good for individual in room data. It is meant for measuring from your listening position with both speakers playing.
I have line arrays and get better data IMO using Parts Express measuring system and a wide frequency burst test tone. I call it a burst for a lack of a better word. It is a very quick sample which helps take room reflections out of the equation.
I have line arrays and get better data IMO using Parts Express measuring system and a wide frequency burst test tone. I call it a burst for a lack of a better word. It is a very quick sample which helps take room reflections out of the equation.
It's a figure of speech. I've been reading his thread The making of: The Two Towers (a 25 driver Full Range line array)
Regards,
Dan
I'm well aware of that superbly documented thread. I was just wondering if there was a gem I had not discovered.
Cheers
William Cowan
...he points out that nonlinear impulse responses are an inherent problem with line arrays.
Hi Dan
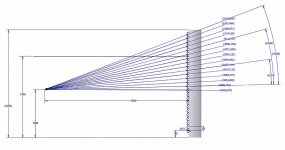
There was an educational thread on the subject Infinite Line Source: analysis.
Well worth a read to help separate the inherent line source issues from the room issues.
Best wishes
David
Last edited:
Let's look at the room and speakers:
and put the impulse next to that:
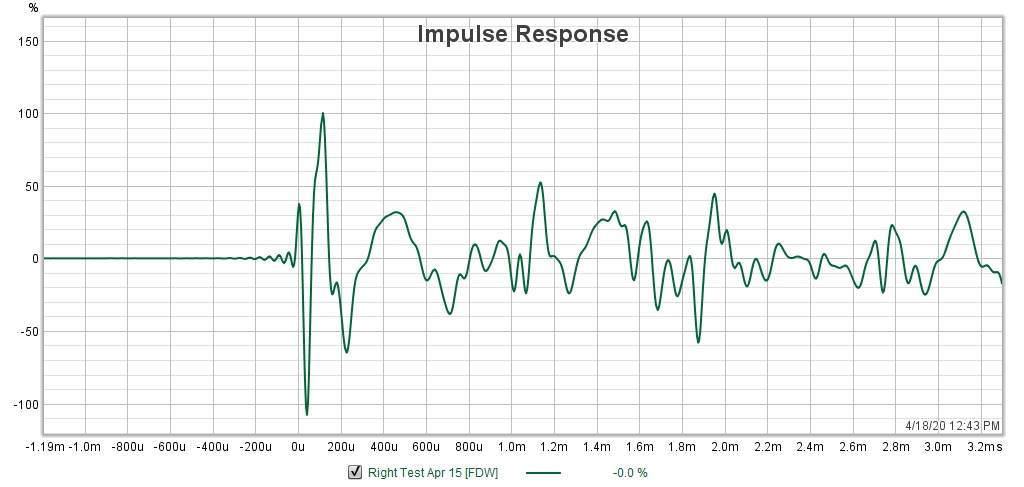
What can we make of that?
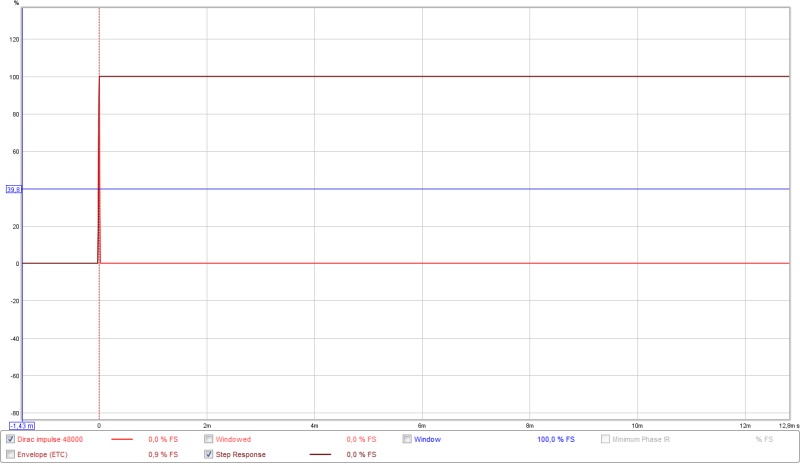
Lets look at a Dirac pulse as an example of the purest signal we could get:

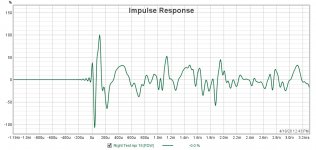
The IR is that narrow spike at the origin. The STEP response is the flat line that floats high in the sky after it's initial rise at the origin.
What does that mean? In our Audio equipment we're never going to see a Dirac pulse and STEP response like that. This is a graph representing an energy burst down from DC to an infinite high frequency.
The IR shows us part of the story, it is a rendering of what's happening, but we need to look at all derivatives to get a more complete picture.
What we do see in the IR is the energy burst (mostly containing high frequency energy) and the response of what comes after that burst.
As we can see, your IR is flipping up and down quite a bit before settling. Part of what we see comes from a cross-over between the two array halves.
Meaning the high frequency, followed by the low frequency. I believe Fluid showed you a couple of 2 way IR responses to compare to in the Rephase thread. What we see here has many more peaks and dips happening after the initial pulse. Our job is to find out why that happens.
First I have to ask the question, what are we looking at here? Is this the IR pulse of a single speaker or were both arrays playing while "catching" this IR?
Sorry I did not write a book yet 😱...
Ronald a.k.a. wesayso...
and put the impulse next to that:
What can we make of that?
Lets look at a Dirac pulse as an example of the purest signal we could get:
The IR is that narrow spike at the origin. The STEP response is the flat line that floats high in the sky after it's initial rise at the origin.
What does that mean? In our Audio equipment we're never going to see a Dirac pulse and STEP response like that. This is a graph representing an energy burst down from DC to an infinite high frequency.
The IR shows us part of the story, it is a rendering of what's happening, but we need to look at all derivatives to get a more complete picture.
What we do see in the IR is the energy burst (mostly containing high frequency energy) and the response of what comes after that burst.
As we can see, your IR is flipping up and down quite a bit before settling. Part of what we see comes from a cross-over between the two array halves.
Meaning the high frequency, followed by the low frequency. I believe Fluid showed you a couple of 2 way IR responses to compare to in the Rephase thread. What we see here has many more peaks and dips happening after the initial pulse. Our job is to find out why that happens.
First I have to ask the question, what are we looking at here? Is this the IR pulse of a single speaker or were both arrays playing while "catching" this IR?
Sorry I did not write a book yet 😱...
Ronald a.k.a. wesayso...
Attachments
Let's look at the room and speakers:
and put the impulse next to that:
What can we make of that?
Lets look at a Dirac pulse as an example of the purest signal we could get:
The IR is that narrow spike at the origin. The STEP response is the flat line that floats high in the sky after it's initial rise at the origin.
What does that mean? In our Audio equipment we're never going to see a Dirac pulse and STEP response like that. This is a graph representing an energy burst down from DC to an infinite high frequency.
The IR shows us part of the story, it is a rendering of what's happening, but we need to look at all derivatives to get a more complete picture.
What we do see in the IR is the energy burst (mostly containing high frequency energy) and the response of what comes after that burst.
As we can see, your IR is flipping up and down quite a bit before settling. Part of what we see comes from a cross-over between the two array halves.
Meaning the high frequency, followed by the low frequency. I believe Fluid showed you a couple of 2 way IR responses to compare to in the Rephase thread. What we see here has many more peaks and dips happening after the initial pulse. Our job is to find out why that happens.
First I have to ask the question, what are we looking at here? Is this the IR pulse of a single speaker or were both arrays playing while "catching" this IR?
Sorry I did not write a book yet 😱...
Ronald a.k.a. wesayso...
Ronald,
Thanks for your input here. These 'token' graphs are always of a single speaker. I still have lots of reading to do but my short term goals are to follow in your footsteps and listen to the effect of some 'light' EQing generated
by REW. Also I'm going to see if I can get DRCDesigner working and see what becomes of that. To use (or over use) a common remark. Tis' a very steep learning curve but it is fun!
Regards,
Dan
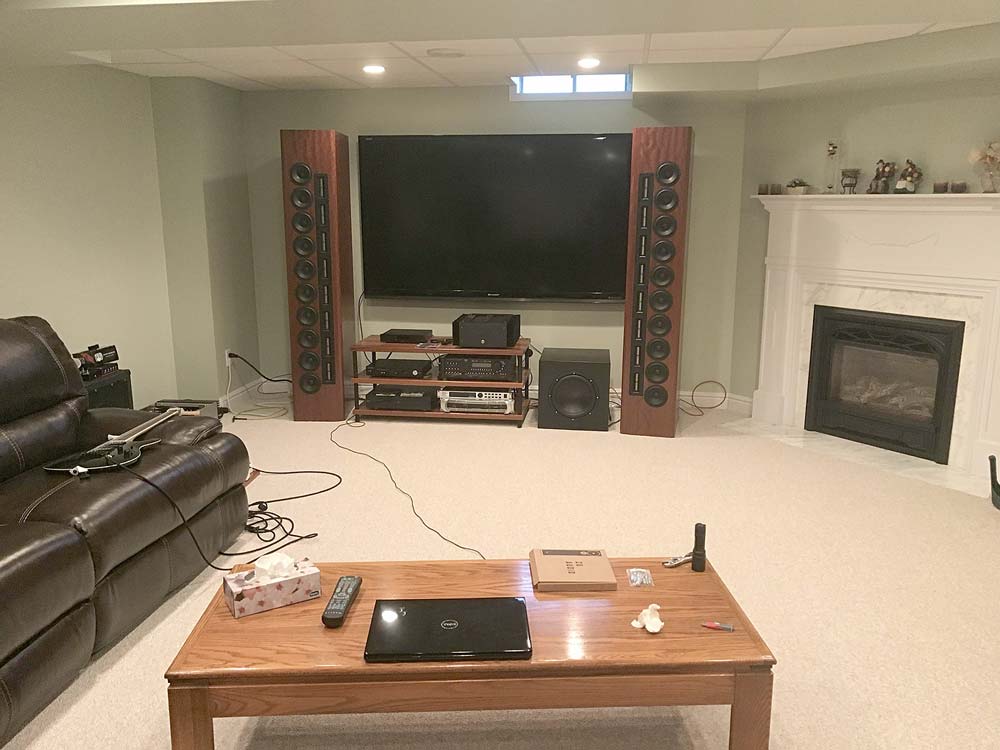
If it were my setup I would want to know where the restlessness after 1ms comes from. It shouldn't be blamed on this being an array.
However if you've been reading my thread you've seen me warn about parallel planes to the array potentially causing trouble. Not saying it is in this case, but I'd look into it.
However if you've been reading my thread you've seen me warn about parallel planes to the array potentially causing trouble. Not saying it is in this case, but I'd look into it.
The start of the impulse has the shape of an LR4 crossover, the rest is still a bit odd and restless, there seem to be some bigger reflections that pop up. The negatives in between are harder to explain.
Is this an averaged measurement or a single point?
The horizontal layout of the drivers will cause some horizontal pattern issues that made be made worse with averages that have significant horizontal distances involved.
Try and pull the speaker into the room if you can and measure about 2m away trying to make the distance to any reflective surface as far away as possible.
If you can this it will help to identify what has changed.
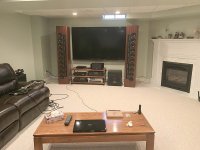
Looking at the image the marble fireplace will be quite reflective and is close, the bulkhead is also close and the truncated line will have less controlled vertical directivity.
I would consider to try pulling the speakers a little further forward and toeing them in towards the centre more that might help with reducing the impact of the surfaces you can't move.
If you want to try DRC my strong advice is to get your head around greg's templates, they are very flexible and a very good way to go.
A convolution based alternative to electrical loudspeaker correction networks
These should get you up and running quickly as there is a good guide. I don't use his templates directly but copy the folder structure and scripts adapted to my own template, heavily copied from wesayso 😉
DRC is complicated and takes some effort to understand but it is a good piece of software.
Trying to make DRC filters for the MiniDSP is a total PITA and is considerably easier to use convolution in a media player if that is available. The tap limitations make low frequency correction IIR only, FIR and IIR can be combined and that is a double PITA to get right 🙂
Is this an averaged measurement or a single point?
The horizontal layout of the drivers will cause some horizontal pattern issues that made be made worse with averages that have significant horizontal distances involved.
Try and pull the speaker into the room if you can and measure about 2m away trying to make the distance to any reflective surface as far away as possible.
If you can this it will help to identify what has changed.
Looking at the image the marble fireplace will be quite reflective and is close, the bulkhead is also close and the truncated line will have less controlled vertical directivity.
I would consider to try pulling the speakers a little further forward and toeing them in towards the centre more that might help with reducing the impact of the surfaces you can't move.
If you want to try DRC my strong advice is to get your head around greg's templates, they are very flexible and a very good way to go.
A convolution based alternative to electrical loudspeaker correction networks
These should get you up and running quickly as there is a good guide. I don't use his templates directly but copy the folder structure and scripts adapted to my own template, heavily copied from wesayso 😉
DRC is complicated and takes some effort to understand but it is a good piece of software.
Trying to make DRC filters for the MiniDSP is a total PITA and is considerably easier to use convolution in a media player if that is available. The tap limitations make low frequency correction IIR only, FIR and IIR can be combined and that is a double PITA to get right 🙂
Last edited:
REW is not that good for individual in room data. It is meant for measuring from your listening position with both speakers playing.
I have line arrays and get better data IMO using Parts Express measuring system and a wide frequency burst test tone. I call it a burst for a lack of a better word. It is a very quick sample which helps take room reflections out of the equation.
Parts Express sell the Omnimic system which is very good if that is what you have.
A sine sweep is a very good way to measure speakers indoors, the length of the sweep or excitation signal does not influence the amount of room in the response measured in the way you are suggesting. You can use a very quick sweep or a very long sweep, it will sound different in the room but the response as measured will be very similar. The longer sweep gives a better signal to noise ratio.
What would change the response is the way that the data is processed and that is different between Omnimic and REW.
This is directly from the Omnimic manual
" Sine Sweep signals provide the cleanest and most accurate
measurements, as well as being able to drive speakers at specific SPL
levels. This is the preferred choice for frequency response
measurements and should be used for all high-frequency
measurements
"Pseudo-noise" test signals, that sound like Pink Noise are easy on the
ears for extended sessions. The accuracy using pseudo-noise at highest
frequencies, however, can be degraded by sample clock tolerances, so
this type should only be used for rough measurements."
My spare time has been scarce lately but with some of it I've been watching
Room Correction With Plugin - DRC Designer Convolution Tutorial Room Eq Wizard
Regards,
Dan 😉
Room Correction With Plugin - DRC Designer Convolution Tutorial Room Eq Wizard
Regards,
Dan 😉
With a few minutes to spare this Sunday afternoon I was reviewing my REW measurements and came up with this. These are the 'vector averaged' impulses of the nine individual measurements I took for each channel. All other issues aside they seem to be a good match.

Regards,
Dan
Regards,
Dan
Attachments

The initial shapes are a good match for the first 100 microseconds but then they start to diverge. The time alignment is good between the measurements but there is an unusual variation in the response before the main peak and dip. The frequency response would vary over time as the room interaction is different
- Home
- Loudspeakers
- Full Range
- Accurately Measuring Line Arrays?