Hello,
Searched and I can't find an answer to this question ...
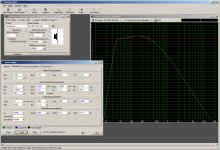
Using WinISD to model woofers, all my transfer function plots show decreasing dB in the higher frequencies well below the woofer mfg.'s freq. response charts . I have seen charts from many others were the woofer's response ramps up to 0 dB and stays there.
I do input most of the driver parameters that WinISD requires to calculate the rest with the exceptions as shown in the pic.
Why are my charts different than many others?
Searched and I can't find an answer to this question ...
Using WinISD to model woofers, all my transfer function plots show decreasing dB in the higher frequencies well below the woofer mfg.'s freq. response charts . I have seen charts from many others were the woofer's response ramps up to 0 dB and stays there.
I do input most of the driver parameters that WinISD requires to calculate the rest with the exceptions as shown in the pic.
Why are my charts different than many others?
Attachments
The high frequency roll off is a function of the voice coils inductance.
The voice coils dc resistance and any added series resistance my effect this as well.
jer 🙂
The voice coils dc resistance and any added series resistance my effect this as well.
jer 🙂
- Status
- Not open for further replies.