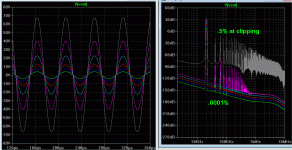
Is it possible to do a THD vs output power graph in LTspice in any way ?
Anyone knows ?
I would like to know about that as well.
Not a graph, but a start
Here's a file...maybe you've already done this, in which case, my apology for the redundancy. A typical kind of amp, and I sweep the drive level. If you look in the Spice error log file (view=>spice error log), you see the output distortion.
I know you wanted a graph, but maybe this is a useful stop along the way.
unzip the model file and the .asc file into the same directory, and run the test case.
Attachments
Here's that Graph!
The enclosed zip file contains a pdf file that describes what's going on in the enclosed LTSpice files.
In a nutshell, it lets you make plots of THD versus input level in LTSpice.
Given this example, you could probably also do THD plots versus frequency, but I haven't tested that. I thought I'd get feedback on the original question first before continuing.
I hope this is useful, and clearly enough documented to be understandaable. Feedback is appreciated.
Dan
Attachments
The enclosed zip file contains a pdf file that describes what's going on in the enclosed LTSpice files.
In a nutshell, it lets you make plots of THD versus input level in LTSpice.
Given this example, you could probably also do THD plots versus frequency, but I haven't tested that. I thought I'd get feedback on the original question first before continuing.
I hope this is useful, and clearly enough documented to be understandaable. Feedback is appreciated.
Dan
It is understandable , but the subcircuit part of it would be problematic to implement with a much larger circuit. It is redundant. thanks for the idea ... I don't know to what level I will abuse it yet. 😀
I have the level stepped and can see both my fourier and error log total THD , therefore I can see the data I need (below 1). It would be a lot of work just to get a handy (level vs. THD graph). 😱 It seems a shame , as I have the total THD data stepped in the log , that it could not be directly plotted out versus the stepped levels.
OS
The FFT with multiple steps shows the progression of H2 -9 as output increases , which is still quite useful.
Attachments
One more link to solution http://www.diyaudio.com/forums/software-tools/202522-ltspice-thd-analyzer.html
- Status
- Not open for further replies.
- Home
- Amplifiers
- Solid State
- THD vs output power in LTspice
