Hi,
I am building some loudspeakers and have chosen to use compression drivers on horns for the HF section.
I'm new to testing loudspeakers and have been using REW with a calibrated microphone.
I'm getting some odd results that see to be to good to be correct??
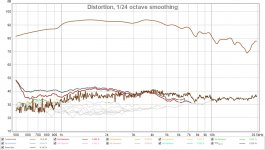
Attached are two pics of distortion tests run on the two drivers on their horns. Do the distortion values not seem over optimistically low to you? I know the frequency response isn't great but I will be using FIR EQ to correct that.
I dont have and other CD's to compare with, what are your thoughts on this?
Thank you in advance for any comments or wisdom you may be able to share.
Alex
I am building some loudspeakers and have chosen to use compression drivers on horns for the HF section.
I'm new to testing loudspeakers and have been using REW with a calibrated microphone.
I'm getting some odd results that see to be to good to be correct??
Attached are two pics of distortion tests run on the two drivers on their horns. Do the distortion values not seem over optimistically low to you? I know the frequency response isn't great but I will be using FIR EQ to correct that.
I dont have and other CD's to compare with, what are your thoughts on this?
Thank you in advance for any comments or wisdom you may be able to share.
Alex
Attachments

Your SPL is quite low are you even driving them with 2.83V or whatever other voltage is used for the nominal sensitivity value?
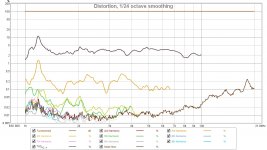
Here are my results in a similar test:
BM-D446 on PH-4220
My distortion is much greater but then again I am +20dB compared to your results.
Here are my results in a similar test:
BM-D446 on PH-4220
My distortion is much greater but then again I am +20dB compared to your results.
Alex,I'm getting some odd results that see to be to good to be correct??
Attached are two pics of distortion tests run on the two drivers on their horns. Do the distortion values not seem over optimistically low to you? I know the frequency response isn't great but I will be using FIR EQ to correct that.
I dont have and other CD's to compare with, what are your thoughts on this?
If the SPL level is correct, and your mic was one meter from the horn mouth, the test level was at perhaps 1/10th to 1/20th of one watt, at that level of input those low values of THD would be fairly typical for a decent compression horn driver.
Art
Hi,
Thank you Kipman and Art, so as you both elude to I'm guessing the measurement power was not enough. I had adjusted volume to be at about the 94dB @1m.
I will retest with 2.83v@1m should be about 110dB and post results. Should I set voltage using a 1KHz sine wave?
Thanks for sharing the knowledge, I'm loving learning about all of this.
Alex
I went back and retested one of the drivers and got the attached response, much more like what I was expecting to see.
Uhm, that's not what I was expecting. The mustard-y graph should be the 2nd harmonic, not the 3rd. If it was just a colour swap, that's fine. If it's actually 3rd harmonics, it's not.
Hi ICG, thanks for commenting, why duo you say that?
The flat line at the top is the fundamental the first jagged line is 2nd and also THD and the third mustardy line is the third. Whats wrong?
Alex
The flat line at the top is the fundamental the first jagged line is 2nd and also THD and the third mustardy line is the third. Whats wrong?
Alex
Hi ICG, thanks for commenting, why duo you say that?
The flat line at the top is the fundamental the first jagged line is 2nd and also THD and the third mustardy line is the third. Whats wrong?
The legend on the bottom of the chart says the red line is 2nd harmonics (which isn't in the chart at all) and the mustard colour is the 3rd. Either the chart is wrong or the measurement or something's wrong with the driver. The 2nd harmonics is usually the highest distortion in a driver/horn combination and the least harsh one. The higher uneven ones are the 'bad' ones. That means, yes, it's definitely not what you'd expect at a distortion measurement.
The red line might be hidden behind the black line, because the difference between 2nd and 3rd harmonics is so large that the THD primarily consists of 2nd harmonic.
As distortion is level dependent, you could EQ the response of driver + horn to flat and set the signal strength at a certain SPL. That way you compare all compression drivers at the same SPL at all frequencies.
Here is an example of how a distortion graph can look (scroll down), measured at 104 dB / 1 m. The 2nd harmonic is at -40 dB (1%) over most of the frequency range. The third harmonic is another 30 dB lower (-70 dB = 0.03%), except at the lower end of the pass band, at which this is 10 dB instead of 30. I would say your measurements look similar. Test Bench: Celestion CDX14-2420 1.4” Compression Driver | audioXpress
Last edited:
TBTL has it right the brown first line is the Total on top of the 2nd. If i untick the THD reading it shows the red line of the 2nd.
Thank you both!
Alex
Thank you both!
Alex
- Status
- Not open for further replies.
- Home
- Loudspeakers
- Multi-Way
- Testing compression drivers