Hi all, I took some Swedes' cravings for high class D amplification and finished a group buy of Anaview AMS1000 modules over at faktiskt.se (thread reboots here, Google translate if you're interested, we got them for ~$250+VAT each) and during the wait I gathered a few measurements from good power amps in class D, AB, H and AAA that are frequently discussed and recommended at faktiskt.se (especially NAD 208, Bryston 4B SST and Rotel RB-1090).
This may not be the best forum for all these commercial products' test data but since nCore, Anaview and IRAUD350 are represented I hope some may find some value in the graphs. If nothing else feel good about their bang-for-the-buck purchase 😉
Sources may or may not approve my consolidation effort but I guess S'phile or SoundstageNetwork et al. will not do this kind of comparison anytime soon so here we go..
Notes/Disclaimers:
Tests consolidated 🙂checked: = "uploaded")
Class AB
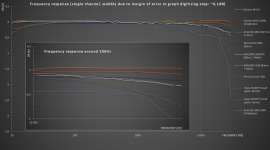
Frequency response (please note the resolution of the source images are limiting and somewhat distorting the "perfect horizontal" graphs 20~9000Hz for most models):

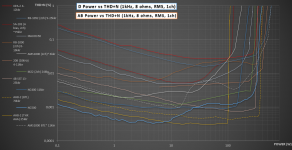
THD+N vs Power (8ohm, 1kHz, 1ch driven)

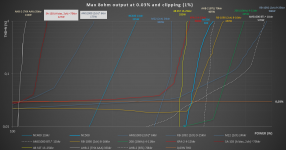
THD+N vs Power close up for 0.03% THD+N and rough clipping power, rounded to nearest 5W (8ohm, 1kHz, 1ch driven)


This may not be the best forum for all these commercial products' test data but since nCore, Anaview and IRAUD350 are represented I hope some may find some value in the graphs. If nothing else feel good about their bang-for-the-buck purchase 😉
Sources may or may not approve my consolidation effort but I guess S'phile or SoundstageNetwork et al. will not do this kind of comparison anytime soon so here we go..
Notes/Disclaimers:
- All models does not have data from all test types
- NAD 208 have very limited data but is still included for above stated reason.
- "(2ch)" after the model name indicates that 2 channels are driven, in contrast with more common one channel.
- "(10kHz)" after the model name indicates that 10kHz is the used, in contrast with the common 1kHz.
- Tool used: WebPlotDigitizer app
- Reddish-yellow lines are class AB/AAA and blueish-white are class D (H is green) BUT, Excel screws with this every time I add a new amp so don't expect the colors to always match.. 😡
- the text "kkr" in each dataset's name is for thousand SEK so divide by ~8,5 and multiply by 1000 to get rough USD market (used if old gear).
- Dotted lines are amps in BTL mode
- More test graphs are coming (not all uploaded today) and more amps added, let me know with a test link if you want a specific one. 😎
- Work started on a web page similar to Build A Graph | headphone.com with all data and end user selections for comparisons etc
Tests consolidated 🙂checked: = "uploaded")
- Frequency response

- THD+N vs Power (8
 and 4 ohm)
 - THD+N vs Frequency response (at ~2W, ~20W, ~max output)
- Some focused part of the main graphs to better see details
- Rough price per watt at clipping
Class AB
- Bryston 4B SST (Soundstage, BHK Labs)
- Emotiva XPA-2 (Secrets of..)
- Rotel RB-1090 (Stereophile)
- NAD 208 (faktiskt.se's user Morello)
- Plinius SA-103 A-bias (Stereophile), AB-bias to come
- Rotel RB-1092 (Secrets of..)
- Hypex nCore NC400 (Audiocirle forum user 'mgalusha')
- Hypex nCore NC500 (official datasheet)
- NAD M22 (nCore modules) (Secrets of..)
- Anaview AMS1000-2600 (Official data sheet and additional test data from Etal Group lab)
- IRAUD350 (Images on Aliexpress..)
- Benchmark AHB-2 (Soundstage, BHK Labs)
Frequency response (please note the resolution of the source images are limiting and somewhat distorting the "perfect horizontal" graphs 20~9000Hz for most models):

THD+N vs Power (8ohm, 1kHz, 1ch driven)

THD+N vs Power close up for 0.03% THD+N and rough clipping power, rounded to nearest 5W (8ohm, 1kHz, 1ch driven)


Forget the pictures. Does it sound pleasing? Where is the harmonic distortion that the human ear loves?
Forget the pictures. Does it sound pleasing? Where is the harmonic distortion that the human ear loves?
Which human. Why would I like the same distortion as you. Wait a minute I don't like distortion.
Thank you for gathering this interesting data.
The Benchmark/THX AAA amp is an impressive device for sure!
Regarding nc400 data, I think it would be fare to use the data from the official spec sheet as this is what is used for the nc500 and anaview modules.
The Benchmark/THX AAA amp is an impressive device for sure!
Regarding nc400 data, I think it would be fare to use the data from the official spec sheet as this is what is used for the nc500 and anaview modules.
Forget the pictures. Does it sound pleasing? Where is the harmonic distortion that the human ear loves?
Why forget them?
Would you care to expand these questions, imho they doesn't seem to relate
Skickat från min iPhone med Tapatalk
Pos, thanks for the appreciation. Regarding NC400 I went with "worst case" and think that 3rd party measurements trumps the manufacturer but perhaps it's more fair to change..or better, I'll add those datasets in the next update.
Now that I think about it I don't think Hypex did publish the nc400 THD vs power curves for an 8 ohms load :/
Some have one (NC400), some don't (NC500, AMS1000) but "need" would be depending on your source output impedance and cable length/resistance. For example, pair a AMS1000 (1,37kOhm - 14,5kOhm) with a DacMagic (<50Ohm) and the frequency variation would be less than ~0,6dB.
- Status
- Not open for further replies.
- Home
- Amplifiers
- Class D
- Test data graphs consolidated for 12 popular power amps (class D, AB, H and AAA)