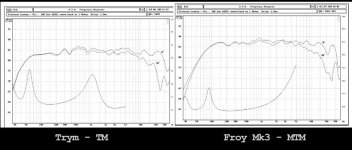
I'm getting ready to build one of the seas kits (most likely the two way Trym), and was looking at the response charts. The Trym, in addition to having lower overall sensitivity than the MTM kits, has a 'bumpier' chart.
How important is 'flatness' of those charts to the overall sound and quality of the speaker (not talking about volume or overall sensitivity, but about the tone or subjective quality)?
Are there other factors, besides the chart, that determine / describe the sound?
If the chart is less flat, is it a big deal?
Attachments
These swept sine-wave response graphs do not say anything about dynamic behavior.
Different cone and dome and cabinet materials add sonic characters that are not revealled in the graphs.
Unbiased listener reviews if you can find some are probably a better indicator.
Eric.
Different cone and dome and cabinet materials add sonic characters that are not revealled in the graphs.
Unbiased listener reviews if you can find some are probably a better indicator.
Eric.
I believe it was the last issue of Audio Critic that did some listening tests and discovered that the speakers that people preferred turned out to be the flattest.
Stereophile has given top marks to speakers having response curves that looked like a roller coaster. Not that Stereophile is all that believable.
Stereophile has given top marks to speakers having response curves that looked like a roller coaster. Not that Stereophile is all that believable.
- Status
- Not open for further replies.