6V6s in Class AB2
Here is a similar version of the amplifier proposed by Miles P back in 2007 (Tee-Vee T00b Amp). This one from the Summer of 2001. Altho the project results were posted on RAT at that time I never authored an article for publication. Real work got in the way. The transient results did appear in the Nov 2003 issue of AudioXpress later as part of another project. And here on DIY from time to time.
This amplifier was not built with listening in mind. Or as a work of art. It is strictly experimental & satisfied some of my curiosities.
I had certain objectives in mind for this project.
The idea for the internal NFB originated with Bill Perkins of PEARL. On a business trip to Calgary I made a point of visiting Bill. He was working on many projects, one of them included NFB from the output plates back to the screen grids of a earlier stage.
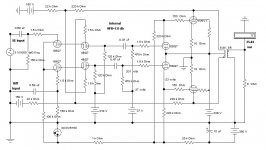
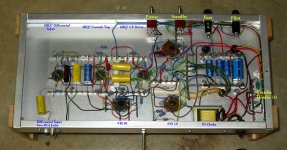
I reasoned that NFB back to the screens would be loaded by the pentode screens, why not try instead the upper grids of a PP cascode stage. The cascode stage is a differential pair of 6BQ7s with a long tail of 100K down to -150V. So the internal NFB is taken from the 6V6 plates. And the resultant internal NFB is ~8 db.
A Hammond 271X power transformer is sufficient to run the 6V6s in Class A. The rectifier is a full bridge of 1N4007 diodes so that both +ve & -ve voltages are available. The +ve filter is a CLC of 10 microF, 5H & 100 microF. The –ve filter CRC of 10 microF, 1.5K & 10 microF. Then 25K & a VR150.
I ran tests both using the amps internal supply & with an external regulated supply.
What would happen in the PS if the amp suddenly was required to pass a large transient signal? In some ways this was similar to what happens to a guitar amp when driven hard.
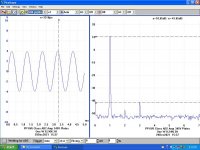
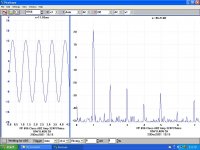
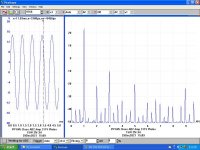
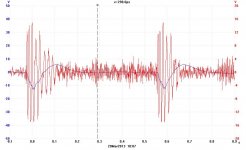
Attached are some of the test results I got recently when I pulled the amp off the shelf for another look. The Scope/SA is a PicoScope 3224. I used a Differential Probe for most of the measurements. For the burst traces the PS sag is the blue trace, the test signal One KHz at 10 Watts.
And it does sound very good. Bench tests are a very good predictor of success.
Here is a similar version of the amplifier proposed by Miles P back in 2007 (Tee-Vee T00b Amp). This one from the Summer of 2001. Altho the project results were posted on RAT at that time I never authored an article for publication. Real work got in the way. The transient results did appear in the Nov 2003 issue of AudioXpress later as part of another project. And here on DIY from time to time.
This amplifier was not built with listening in mind. Or as a work of art. It is strictly experimental & satisfied some of my curiosities.
I had certain objectives in mind for this project.
- PP 6V6s in Class AB2
- NFB to the upper grids of a differential cascode stage
- Transient performance of the amplifier while powered by a limited power supply
The idea for the internal NFB originated with Bill Perkins of PEARL. On a business trip to Calgary I made a point of visiting Bill. He was working on many projects, one of them included NFB from the output plates back to the screen grids of a earlier stage.
I reasoned that NFB back to the screens would be loaded by the pentode screens, why not try instead the upper grids of a PP cascode stage. The cascode stage is a differential pair of 6BQ7s with a long tail of 100K down to -150V. So the internal NFB is taken from the 6V6 plates. And the resultant internal NFB is ~8 db.
A Hammond 271X power transformer is sufficient to run the 6V6s in Class A. The rectifier is a full bridge of 1N4007 diodes so that both +ve & -ve voltages are available. The +ve filter is a CLC of 10 microF, 5H & 100 microF. The –ve filter CRC of 10 microF, 1.5K & 10 microF. Then 25K & a VR150.
I ran tests both using the amps internal supply & with an external regulated supply.
What would happen in the PS if the amp suddenly was required to pass a large transient signal? In some ways this was similar to what happens to a guitar amp when driven hard.
Attached are some of the test results I got recently when I pulled the amp off the shelf for another look. The Scope/SA is a PicoScope 3224. I used a Differential Probe for most of the measurements. For the burst traces the PS sag is the blue trace, the test signal One KHz at 10 Watts.
And it does sound very good. Bench tests are a very good predictor of success.
Attachments
-
 026 Cascode Amp A.JPG710.7 KB · Views: 294
 -
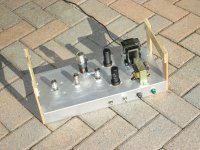
 IMG_1383 Cascode Amp Bottom A 14W E Flash Labelled.jpg437.1 KB · Views: 385
 -
 Cascode Amp H.jpg74.1 KB · Views: 376
 -
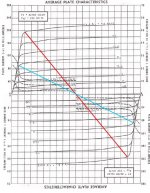 6V6GTA 14W 4 PushPull C 6W.jpg60.4 KB · Views: 352
 -
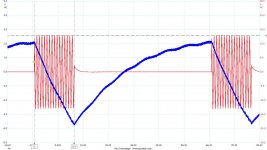 20220102-0003 Burst.jpg104.3 KB · Views: 247
 -
 009 One Watt 345V Int Supply D%.JPG94.8 KB · Views: 231
 -
 007 10W 324V Int Supply D%.JPG91.7 KB · Views: 219
 -
 006 15W 311V Int Supply D%.JPG102.5 KB · Views: 228
 -
 IMG_1383 Cascode Amp Bottom A 14W E Flash Labelled.jpg437.1 KB · Views: 214
 -
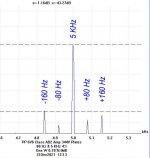 001 SMPTE at One Watt w IMD Sidebands Identified C.jpg54.5 KB · Views: 255
 -
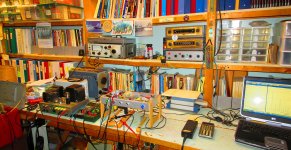 IMG_6383 to 6384 Work Bench 12W E.jpg621.8 KB · Views: 261
Last edited:

OK!! Real results, not a sim! 🙂 Here goes ...
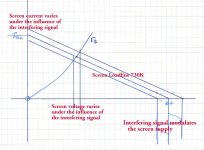
The blue loadline looks to be a bit over 5k?
I take it that the input impedance of a pentode screen grid g2 is significantly lower that that of g1 of the cascode?
The scope shows (near) linear sag of approx 32V over some 15ms. With all of the 110uF available, that looks like some 235mA of discharge current flowing for the 15ms burst, or some 7.5W delivered from an output impedence of about 135 Ohm. This in addition to the quiescent current which was ... ?
Looking at the steady-state FFT for 10W (@1kHz?) B+ is at 324V - is that some 21V lower than zero-signal idle?
And a BIG, BIG THANK YOU for posting real test results.
To run in Class AB2 the PP 6V6 loadline has been adjusted to 6.8K
The blue loadline looks to be a bit over 5k?
NFB back to the screens would be loaded by the pentode screens, why not try instead the upper grids of a PP cascode stage
I take it that the input impedance of a pentode screen grid g2 is significantly lower that that of g1 of the cascode?
For the burst traces the PS sag is the blue trace, the test signal One KHz at 10 Watts.
The scope shows (near) linear sag of approx 32V over some 15ms. With all of the 110uF available, that looks like some 235mA of discharge current flowing for the 15ms burst, or some 7.5W delivered from an output impedence of about 135 Ohm. This in addition to the quiescent current which was ... ?
Looking at the steady-state FFT for 10W (@1kHz?) B+ is at 324V - is that some 21V lower than zero-signal idle?
And a BIG, BIG THANK YOU for posting real test results.
The blue loadline looks to be a bit over 5k.
You are correct, the composite loadline I put together a while ago was simply an example of how the loadline would rotate clockwise into +ve G1 mode.
I need to draw the real thing sometime soon.
----------------------------------------------
NFB back to the screens would be loaded by the pentode screens, why not try instead the upper grids of a PP cascode stage
For common voltage amplifier pentodes such as the 6AU6 the screen looks like ~30K. I measured this on the pentode in a 6U8 a few years ago.
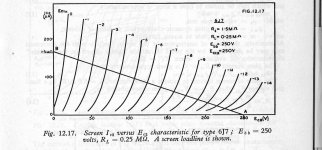
Calculations shew the same. I'll post that work later. And here it is from a page in RDH4 for a 6J7. The screen resistance can be estimated from
the slope of the curve at the Q Point.
The upper grids of a Cascode draw no DC current. They are simply a capacitive load at audio frequencies.
------------------------------------------------------
The scope shows (near) linear sag of approx 32V over some 15ms. With all of the 110uF available, that looks like some 235mA of discharge current flowing for the 15ms burst, or some 7.5W delivered from an output impedence of about 135 Ohm. This in addition to the quiescent current which was ... ?
The scale on that trace might be incorrect, I need to pull the data up & have a look. Sometimes when I changed the probe from X10 to X100 or back I'd
forget to tell the conversion software. That did create some problems.
-----------------------------------------------------
Looking at the steady-state FFT for 10W (@1kHz?) B+ is at 324V - is that some 21V lower than zero-signal idle?
The PS is intended to be minimal so that a relation to low cost amplifiers can be made. That would include for example a guitar amp.
The attached is Peter Gabriel performing a short part of Salisbury Hill.
----------------------------------------
Thankyou for your questions, I've often found people don't care much for the details.
You are correct, the composite loadline I put together a while ago was simply an example of how the loadline would rotate clockwise into +ve G1 mode.
I need to draw the real thing sometime soon.
----------------------------------------------
NFB back to the screens would be loaded by the pentode screens, why not try instead the upper grids of a PP cascode stage
For common voltage amplifier pentodes such as the 6AU6 the screen looks like ~30K. I measured this on the pentode in a 6U8 a few years ago.
Calculations shew the same. I'll post that work later. And here it is from a page in RDH4 for a 6J7. The screen resistance can be estimated from
the slope of the curve at the Q Point.
The upper grids of a Cascode draw no DC current. They are simply a capacitive load at audio frequencies.
------------------------------------------------------
The scope shows (near) linear sag of approx 32V over some 15ms. With all of the 110uF available, that looks like some 235mA of discharge current flowing for the 15ms burst, or some 7.5W delivered from an output impedence of about 135 Ohm. This in addition to the quiescent current which was ... ?
The scale on that trace might be incorrect, I need to pull the data up & have a look. Sometimes when I changed the probe from X10 to X100 or back I'd
forget to tell the conversion software. That did create some problems.
-----------------------------------------------------
Looking at the steady-state FFT for 10W (@1kHz?) B+ is at 324V - is that some 21V lower than zero-signal idle?
The PS is intended to be minimal so that a relation to low cost amplifiers can be made. That would include for example a guitar amp.
The attached is Peter Gabriel performing a short part of Salisbury Hill.
----------------------------------------
Thankyou for your questions, I've often found people don't care much for the details.
Attachments
The PS is intended to be minimal so that a relation to low cost amplifiers can be made.
Yep, and a fine example it is - I have found that I spend more time designing, constructing and de-bugging the power supply than the signal circuit.🤐
And here it is from a page in RDH4 for a 6J7.
Thanks for the RDH reminder - I will re-read, as it's kinda important and I had forgotten it.👍
The scale on that trace might be incorrect
Fair enough - the indicated output impedance might be a bit high even for a minimal power supply, though output impedances in the order of several tens of ohms have been reported by others (see E V Karpov, "The Simple High Voltage Regulator"). Regardless, it is the kind of result I find very interesting - taken at face value, the high output impedance appears to have dropped Vak by 10% which would be quite significant if the 6V6 was operating in triode mode, less so as it is operating as a pentode.
The attached is Peter Gabriel performing a short part of Salisbury Hill.
Not "Sledgehammer"?
 😊
😊I take it that the input impedance of a pentode screen grid g2 is significantly lower that that of g1 of the cascode?
-------------------------
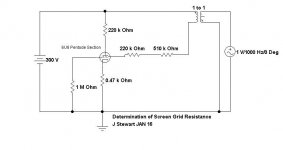
Screen Resistance Measurement for a Voltage Amplifier Pentode John L Stewart Jan 2016
When designing or building an ordinary vacuum tube audio amplifier with a pentode front end we can for the most part ignore the screen supply resistance. Simply set it to be in the range of 3-4 times the plate resister & the circuit will perform satisfactorily. As long as the screen resister is adequately bypassed there are no significant problems.
That all changes when the intention is to use NFB. Most folks would assume that the RC time constant is simply the screen resister times the screen bypass capacitor. That can lead to problems since the screen supply resister is actually in parallel with the resistance of the screen grid itself as seen looking into the tube. Some calculations using the available published tube data indicates the screen resistance of common audio voltage amplifier pentodes to be in the range of 50K.
This simple setup makes measurements leading to the incremental screen resistance of the pentode section of a 6U8 vacuum tube while in operation. The tube is connected to a plate supply of 300 volts. The screen is fed from this supply thru a total of 730K resistance. But interposed on that is a means of applying an interfering One KHz test signal. Any audio transformer of high impedance primary & secondary can be used to couple the audio signal generator to the high voltage on the screen. I used an old Hammond 447 Interstage Transformer.
Just two measurements are required. Using a differential probe the AC voltage drop across the 730K is measured, then the AC voltage from common to screen.
The results are as follows-
First Pass- Drop across 730K was 0.9V
So Ig2 is 0.9 V / 0.73 M, 1.23 mA And Eg2 measured 0.043V
So rs is DE / DI rs = (0.043V / 1.23 mA)K or 35.0K
2nd Pass- Drop across 730K was 2.83V
So Ig2 is 2.83 V / 0.73 M, 3.88 mA And Eg2 measured 0.133V
So rs is DE / DI rs = (0.133V / 3.88 mA)K or 34.3K Done
-------------------------
Screen Resistance Measurement for a Voltage Amplifier Pentode John L Stewart Jan 2016
When designing or building an ordinary vacuum tube audio amplifier with a pentode front end we can for the most part ignore the screen supply resistance. Simply set it to be in the range of 3-4 times the plate resister & the circuit will perform satisfactorily. As long as the screen resister is adequately bypassed there are no significant problems.
That all changes when the intention is to use NFB. Most folks would assume that the RC time constant is simply the screen resister times the screen bypass capacitor. That can lead to problems since the screen supply resister is actually in parallel with the resistance of the screen grid itself as seen looking into the tube. Some calculations using the available published tube data indicates the screen resistance of common audio voltage amplifier pentodes to be in the range of 50K.
This simple setup makes measurements leading to the incremental screen resistance of the pentode section of a 6U8 vacuum tube while in operation. The tube is connected to a plate supply of 300 volts. The screen is fed from this supply thru a total of 730K resistance. But interposed on that is a means of applying an interfering One KHz test signal. Any audio transformer of high impedance primary & secondary can be used to couple the audio signal generator to the high voltage on the screen. I used an old Hammond 447 Interstage Transformer.
Just two measurements are required. Using a differential probe the AC voltage drop across the 730K is measured, then the AC voltage from common to screen.
The results are as follows-
First Pass- Drop across 730K was 0.9V
So Ig2 is 0.9 V / 0.73 M, 1.23 mA And Eg2 measured 0.043V
So rs is DE / DI rs = (0.043V / 1.23 mA)K or 35.0K
2nd Pass- Drop across 730K was 2.83V
So Ig2 is 2.83 V / 0.73 M, 3.88 mA And Eg2 measured 0.133V
So rs is DE / DI rs = (0.133V / 3.88 mA)K or 34.3K Done
Attachments
Thanks for the RDH reminder - I will re-read, as it's kinda important and I had forgotten it.
The 6J7 screen plot is on p 513, RDH4.
--------------------------------------------------------------------------
Not "Sledgehammer"?
Next time the amp is cranked up I'll run sledgehammer as a test!
The 6J7 screen plot is on p 513, RDH4.
--------------------------------------------------------------------------
The attached is Peter Gabriel performing a short part of Salisbury Hill.
Not "Sledgehammer"?
Next time the amp is cranked up I'll run sledgehammer as a test!
Attachments
Screen Resistance Measurement for a Voltage Amplifier Pentode John L Stewart Jan 2016
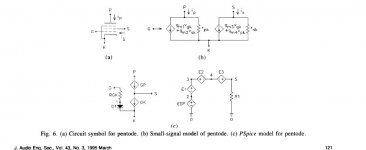
Thank you, John - that's a lovely method and a crystal-clear write-up. It prompted me to re-visit Marshall Leach's 1995 JAES paper on SPICE models for triodes and pentodes (see the attached snip of the small signal model). I wonder if the output impedance of the screen grid is "bundled up" into the parameter rsk in the small signal model? Plugging his figures for the 6L6 into the formulae in his paper, I get rpk of 69.7kOhm (plausible) and rsk of 1.6kOhm (that's quite the load, if I have calculated correctly). Does does it make sense?
Attachments
The results I got were for a small signal pentode & may not apply to power pentodes.
And especially beam tubes such as the 6L6 which are designed to minimize screen current.
That all needs another look. Something to rethink during the next few days. As more snow falls.
A great year for the ski hill operators.
And especially beam tubes such as the 6L6 which are designed to minimize screen current.
That all needs another look. Something to rethink during the next few days. As more snow falls.
A great year for the ski hill operators.
I believe your screen current results are off by several orders of magnitude. Your mA should be uA in both cases, above. Yes - no?
You are absolutely correct. I simply copied that from the original document which is in MS Word,
where Greek letters are OK. When they move to DIY Greek letter mu simply becomes lower case m.
So should read 'micro' not 'm'.
where Greek letters are OK. When they move to DIY Greek letter mu simply becomes lower case m.
So should read 'micro' not 'm'.
- Home
- Amplifiers
- Tubes / Valves
- PP 6V6s in Class AB2