High there!
I need some help, about SPL vs frequency graphs of loudspeakers.
Here is the problem (with some explanation): recently I rediscovered an article by Mark Rumreich "A New Approach to Box Design and Woofer Selection" published in SB 1/92 (here you have it: A New Approach to Box Design and Woofer Selection ) which I find very interesting and usefull for quick preliminary look at what you can use one speaker driver for. By usig just three T/S parameters of a speaker (Fs, Qts and Vas) you can see how one driver is going to behave in diferent box volumes.
But, mr. Rumreich gives some generalized graphs (plots) that can be usefull, although not so practical.
I am doing an xls spreadsheet for quick calculations based on this article and I want to make my own plots of normalized frequency response for particular speaker in particular box, for standard 1/3 octave response. And I do not know the formulas to calculate that.
To be honest, in spring of '92 I had done a GW-basic program that did the work but years have done better job, I forgot how I did it. And that little program is lost sometime somewhere in my old discarded PCs. Now I am going in circles like a mouse in that turning wheel with no escape... I tried to find something in Unibox (by mr. Bagby) but it is protected and I can't open it to see the formulas, so I need some help from you. If you can show me the direction or provide me some formulas, I'll be very thankfull.
And I hope that my question is not too confusing.
Vedran
What is the frequency response normalized by?
Off the top of my head I assume you want to normalize the response by some other response. In that case you just subtract the SPL level of the response that you want everything normalized by.
Off the top of my head I assume you want to normalize the response by some other response. In that case you just subtract the SPL level of the response that you want everything normalized by.
Check out MATAA, which has a smoothing function (open source).High there!
I need some help, about SPL vs frequency graphs of loudspeakers.
Here is the problem (with some explanation): recently I rediscovered an article by Mark Rumreich "A New Approach to Box Design and Woofer Selection" published in SB 1/92 (here you have it: A New Approach to Box Design and Woofer Selection ) which I find very interesting and usefull for quick preliminary look at what you can use one speaker driver for. By usig just three T/S parameters of a speaker (Fs, Qts and Vas) you can see how one driver is going to behave in diferent box volumes.
But, mr. Rumreich gives some generalized graphs (plots) that can be usefull, although not so practical.
I am doing an xls spreadsheet for quick calculations based on this article and I want to make my own plots of normalized frequency response for particular speaker in particular box, for standard 1/3 octave response. And I do not know the formulas to calculate that.
To be honest, in spring of '92 I had done a GW-basic program that did the work but years have done better job, I forgot how I did it. And that little program is lost sometime somewhere in my old discarded PCs. Now I am going in circles like a mouse in that turning wheel with no escape... I tried to find something in Unibox (by mr. Bagby) but it is protected and I can't open it to see the formulas, so I need some help from you. If you can show me the direction or provide me some formulas, I'll be very thankfull.
And I hope that my question is not too confusing.
Vedran
https://github.com/mbrennwa/mataa
Qwestion wrong stated!
First of all, I apologize for not previously reported to thank you for your kind answers but I had personal problems with higher priority.
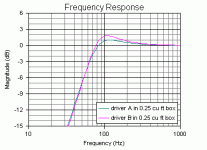
however, the question was raised wrong, I want to draw a graph of the relative frequency response of speakers in an arbitrary case like this one I attached here.
But, as I stated before, I do non recall correct formulas to calculate relative SPL for some particular frequencies (like 10Hz, 15hz, 30Hz, 100Hz or any other one). I hope this is more clear.
We are all using some of available simulation softwares, but none of them gives quick simulation for more box volumes simultaneously (6 of them for one driver in one graph).
That is my intention.
Thanks for your time,
Vedran
First of all, I apologize for not previously reported to thank you for your kind answers but I had personal problems with higher priority.
however, the question was raised wrong, I want to draw a graph of the relative frequency response of speakers in an arbitrary case like this one I attached here.
But, as I stated before, I do non recall correct formulas to calculate relative SPL for some particular frequencies (like 10Hz, 15hz, 30Hz, 100Hz or any other one). I hope this is more clear.
We are all using some of available simulation softwares, but none of them gives quick simulation for more box volumes simultaneously (6 of them for one driver in one graph).
That is my intention.
Thanks for your time,
Vedran
Attachments
Well, I just found instructions on Mr. Brian Steele's page (The Subwoofer DIY Page) and that will help.
Thanks, Vedran
Thanks, Vedran
- Status
- Not open for further replies.
- Home
- Design & Build
- Software Tools
- Plotting normalized frequency response - Help!