Hi everyone,
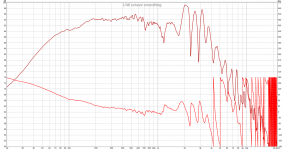
I'm working on a pair constant directivity speakers similar to Dr. Geddes' NA12 (superficially, at least 🙂) and I noticed something strange when measuring the woofer (Eminence Deltalite II 2512) after stuffing the box: a bump in the impedance curve at about 150Hz as well as a 3dB shelf in the nearfield frequency response centered at the same frequency. The impedance bump did not appear to be present before stuffing the box (unfortunately, I didn't measure the FR at that time).
Any idea what might be causing this? The other cabinet measures the same.
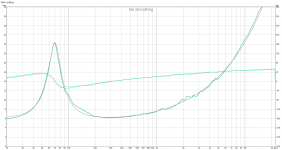
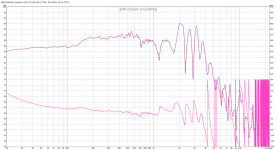
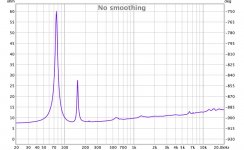
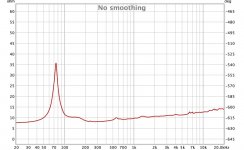
Attachments are, in order: 1) Impedance without stuffing; 2) Impedance with stuffing; 3) Nearfield frequency response; 4) Same as 3, but with a linkwitz transform set according to 2.
I'm working on a pair constant directivity speakers similar to Dr. Geddes' NA12 (superficially, at least 🙂) and I noticed something strange when measuring the woofer (Eminence Deltalite II 2512) after stuffing the box: a bump in the impedance curve at about 150Hz as well as a 3dB shelf in the nearfield frequency response centered at the same frequency. The impedance bump did not appear to be present before stuffing the box (unfortunately, I didn't measure the FR at that time).
Any idea what might be causing this? The other cabinet measures the same.
Attachments are, in order: 1) Impedance without stuffing; 2) Impedance with stuffing; 3) Nearfield frequency response; 4) Same as 3, but with a linkwitz transform set according to 2.
Attachments

Last edited:
My guess is that the stuffing changed the speed of sound in the box, so that spike at 220 became the bump at 150. That shelf could be the baffle step? How far away is the microphone? By near field do you mean 1/2 inch from cone?
The microphone was about 1/4in from the dust cap, which I would expect to pretty much eliminate the influence of the baffle.
I saw this kind of secondary spike not a long time ago on a sealed box Z plot someone sent me. High sensitivity 12 inch full range. Had a thin pressed wool absorptive material layer all around. I suspected box height mode resonance. I recommended he stuffed the bottom part of the enclosure liberally with something handy but fluffy. After that the spike was gone and the main resonance lost many Ohms of peak as well.
Call is skepticism or call it good lab practice, but try substituting an 8-Ohm resistor and see what the curve looks like added to the driver plot. The resistor curve then serves as the benchmark for your measurement system.
The extra step may not be relevant to your question but good practice.
B.
The extra step may not be relevant to your question but good practice.
B.
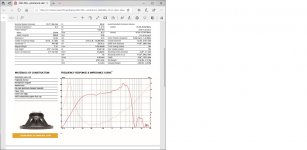
Data sheet
Looks like that rise appears in the data sheet. It appears to be at a similar frequency range anyway. You could ask Eminence tech support about it. Professional drivers, and those intended for instrument use can have interesting characteristics.
Looks like that rise appears in the data sheet. It appears to be at a similar frequency range anyway. You could ask Eminence tech support about it. Professional drivers, and those intended for instrument use can have interesting characteristics.
Attachments
There is an upper frequency limit for the validity of near field measurements. Fmax = 4311 / D, so assume 11" cone, that would be 390 Hz. Not sure if that could help explain the rise. HiFi Loudspeaker Design
@bentoronto: I've calibrated the impedance measuring device. Resistive loads show a flat line.
@Salas: Interesting; I wonder why my graphs show a significant reduction in frequency (220Hz to 150Hz), while yours do not.
@Salas: Interesting; I wonder why my graphs show a significant reduction in frequency (220Hz to 150Hz), while yours do not.
Last edited:
Different stuffing material maybe? He did not have speaker stuffing and used an old duvet for the test. See if you have any air leaks also.
No significant air leaks as far as I can tell. I used fiberglass insulation.
Any insight on the 3dB shelf in the nearfield FR?
Any insight on the 3dB shelf in the nearfield FR?
The impedance peaks in the factory graph look like a resonance train inherent in the driver.
My initial thot wrt youtr highQ peak is a leak in the box.
dave
The high-Q peak is without stuffing. What is puzzling me is the broad bump at ~150Hz in the second graph.
One dimension in this box might be around 40cm?..I suspected box height mode resonance.
a resonance train
Attachments
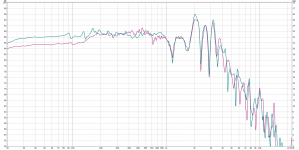
The frequency response anomaly appears to be related to baffle step, surprisingly. I thought that putting the microphone right on the dust cap would eliminate baffle effects, but apparently that is not always the case. I guess it must be due to the narrow (relative to the woofer size) baffle and big roundover. Anyway, I effectively tripled the baffle width by putting the other cabinet on one side and a big subwoofer on the other side with a towel between each to seal the gap. I then did another measurement with the microphone in a similar position and the shelf was pretty much gone. Magenta is with nothing near the speaker and cyan is the configuration described above.
Attachments
Last edited:
One dimension in this box might be around 40cm?..
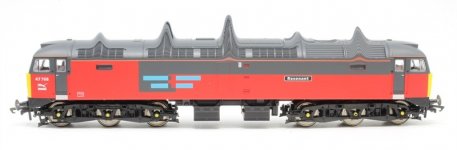
Possibly, I only know rough volume. But from a photo its a tall one meant to keep the FR driver at the vicinity of a seated listener's ear height. Lowest dimensional resonance mode happens when the longest dimension is equal to half a wavelength of the sound. If its one meter tall box it could start at about 170Hz.
The high-Q peak is without stuffing. What is puzzling me is the broad bump at ~150Hz in the second graph.
The factory impedance plot suggests that it is a resonance train inherent in the driver. There are ~integer multiples of that going all the way up. Only way to fix that, if that is indeed the case, is to modify the driver. I have seen many of those trains and they are usually heard.
dave
- Home
- Loudspeakers
- Multi-Way
- Impedance anomaly in sealed enclosure