Use the attach picture function to upload the picture, there are thousands of tutorials on how to read a frequency response graph online, please search for them.
 thanks for guide to upload the picture, i wish that i can get help here about how to read this graph hehehe
What do you not understand ?
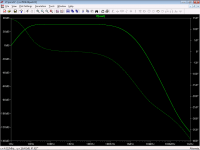
It is showing the output of the amplifier as having a gain of around 35db compared to Vin. You can deduce the -3db points by using the cursor cross hairs (left click Vout on the graph either once or twice to add one or two crosshairs).
The dotted line is the phase response of the amplifier. At really high frequencies it becomes a bit meaningless for a number of reasons such as the models will not account for stray parasitics that would influence a real design. You can have phase shifts of more than 360 degrees as phase shift is cumulative and needs to account for time as well.
well thanks for the explanation btw im very beginer for this things an hope can get alot of knowlege here thanks once again
ArDean,
The reference no. in dBs
The reference no. in dBs
is the gain. On the right in degrees is the phase, below in Hz,KHz,MHz,GHz is the span of frequencies. The point in gain where the slope falls downward, that is the cut-off frequency.
Hope I have added a few info.
Sa muli,
Albert
Hope I have added a few info.
Sa muli,
Albert
thanks ocampo, after this freq rspone i wan to know the phase margin and the gain margin, is that any standart of how the suitable number of good pm gm of the amplifier?

can anyone explain to me what is this, or i mean is it the suitabe phase margin and gain margin?
thanks gogo, but how come you say that is good pm/gm, on based of what can u explain to me please
thanks gogo, but how come you say that is good pm/gm, on based of what can u explain to me please
It is used to "measure" stability. Amps will become unstable if there is infinite gain. Infinite gain happens when certain conditions are met (it's a Math thing). PM/GM measures how far we are from instability (gain 0 dB, inverted phase).
I think PM/GM=50/10 is a fair thresholds. I don't design for PM/GM but I think I have never got below 60/20.
thanks ocampo, after this freq rspone i wan to know the phase margin and the gain margin, is that any standart of how the suitable number of good pm gm of the amplifier?
Check Chapter 4 of "Designing Audio Amplifier Handbook" by Bob Cordell 😉
hello please help me how to read this graph?
this is an loop gain graph, i had try to read and watch video from moderator but still i cant get it hehe sorry i was to newbe
this is an loop gain graph, i had try to read and watch video from moderator but still i cant get it hehe sorry i was to newbe
How does the closed loop gain plot looks like? Your loop gain graph doesn't look right.
Regards,
Albert
Regards,
Albert

- Status
- Not open for further replies.
- Home
- Design & Build
- Software Tools
- how to read the freq respone of an amplifier