
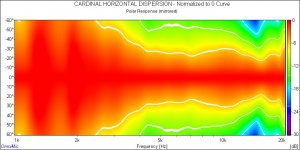
Not sure which software has generated that graph but in all likelyhood it's done using something like arta or rew or one of the other measuring sofwares. Doing off axis measurements through 180 or 360 degrees.
Tony.
Tony.
Depends if you want measured or predicted. That one looks predicted using one of the crossover/speaker simulation tools, I can get these from Boxsim.
If measured you need a microphone (possibly a preamp) and a way to connect it to a pc. The UMIK-1 from minidsp is a favourite as it is all built into 1 and plugs into the USB port and comes with a calibration file. Alternatives are the Behringer ECM8000 that needs a usb preamp with phantom power like the UMC202HD I have, though this only comes with a generic calibration file.
If measured you need a microphone (possibly a preamp) and a way to connect it to a pc. The UMIK-1 from minidsp is a favourite as it is all built into 1 and plugs into the USB port and comes with a calibration file. Alternatives are the Behringer ECM8000 that needs a usb preamp with phantom power like the UMC202HD I have, though this only comes with a generic calibration file.
Arta can be used. You can also do a crossover in 3D, but you'll need to do your own DI calculations. Link.
Yes, ARTA can do this. You need to do a bunch of response measurements at say 30 deg intervals, then ARTA stitches the individual responses together to this plan view.
Jan
As noted, ARTA can do that. There's a description somewhere in the help manual, I actually think it is the STEPS app in ARTA that does this. I've done it a few times with a friend, went with no problems but it takes time as you need to do a response test, then change the speaker angle, do a response test, etc.
Then in ARTA/STEPS you select all the individual response files and activate the command that stitches them together. Works like a charm.
Jan
Then in ARTA/STEPS you select all the individual response files and activate the command that stitches them together. Works like a charm.
Jan
That's great.
Just make the necessary FR sweeps at different angles.
Add all the curves after that and normalize to the 0 deg curve (ie on-axis).
Click the small Polar button on the right and it'll display the Polar plot.
Just make the necessary FR sweeps at different angles.
Add all the curves after that and normalize to the 0 deg curve (ie on-axis).
Click the small Polar button on the right and it'll display the Polar plot.
Thanks Michael. I just started a new project and this will be very helpful as it is not a normal build.
- Status
- Not open for further replies.
- Home
- Loudspeakers
- Multi-Way
- How do I get this measurement???