Hello,
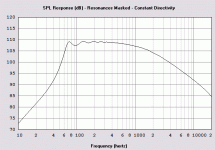
Now I'm finished with my ML calculations I put the values into hornresp. Problem for me is that I can't analyse the graph.
For example, i don't now if the dip around 95 Hz is 'worse' (see attachment) or not..
So, could anyone help me analysing this graph and tell me if this frequency response is 'good' or not?
regards
Attachments
Hello,
Worse in comparison to what? I would want a smoother response at the low end - instead of that dip and peak, a smooth roll off. However it is not too bad.
Why did you model in 1/8th space? If you are planning on using the horn to a higher frequency, I would imagine you would want it out in the room (out of the corner), so you will probably be radiating into something more like 1/2 space. This will make a difference in the response - your mouth will be way too small for that flair rate.
I would also ask what your design is intended for - I see you haven't used a rear chamber. Are you going for a back-loaded horn?
Hello,
I wondered if this frequency response is acceptable or not because i compromised the horn length/mouth size.
I'm going for a back-loaded horn. The front of the driver will radiate directly into the room, together with a tweeter.
I would like to build a basshorn, and because i don't have very much space, the size is reduced most when placing in a corner.
In this case i use a 50 hz cutoff. Would it be enough for good bass reproduction? I mostly listen to trance and disco, so could i use a higher cutoff frequency to get good bass reproduction or not?
best regards
John Sheerin said:
Worse in comparison to what?
I wondered if this frequency response is acceptable or not because i compromised the horn length/mouth size.
John Sheerin said:I would also ask what your design is intended for - I see you haven't used a rear chamber. Are you going for a back-loaded horn?
I'm going for a back-loaded horn. The front of the driver will radiate directly into the room, together with a tweeter.
John Sheerin said:
Why did you model in 1/8th space?
I would like to build a basshorn, and because i don't have very much space, the size is reduced most when placing in a corner.
In this case i use a 50 hz cutoff. Would it be enough for good bass reproduction? I mostly listen to trance and disco, so could i use a higher cutoff frequency to get good bass reproduction or not?
best regards
I just tried some things with hornresp, but even if i use the ideal mouth area and horn length for 50 hz the dip and peak don't disappear. It's only getting better when i fill in values for a compression chamber, but because i'm going to build a back loaded horn i won't use one...
I used Leach's math and i checked everything, so i don't know how i can get a smoother response at the low frequencies. Will the frequency response viewed at the graph at the first post be low enough for good bas or not??
regards
I used Leach's math and i checked everything, so i don't know how i can get a smoother response at the low frequencies. Will the frequency response viewed at the graph at the first post be low enough for good bas or not??
regards
Greets!
You'll need solid performance down to ~40 Hz. To smooth out a Leach style BLH requires a very low Fc. IOW keep dropping 'Flm' until the compression chamber is room sized, or just use Flm = (Fs*Qts)/2. Of course you're going to have an extremely long, slow expansion, but that's the price you pay for smoothness.
More practical is to measure your room's response and design a FLH that peaks ~in your room's nulls and vice versa to achieve a ~smooth in-room response.
GM
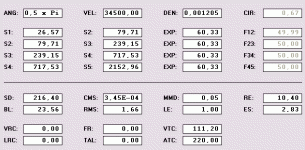
e-side said:And these are the calculated values
Whoah! You have MMD at 0.05 - this is too low. Maybe you typed in measurement for kg, which means this should be 50.
Throat is also way too small - start with around 80 to 100, increase total horn length a fraction, and aim for F of each section around the 25Hz to 30Hz region (you won't get the response down as low as the theoretical cutoff).
Cheers
Graeme
GM said:Of course you're going to have an extremely long, slow expansion, but that's the price you pay for smoothness.
Leach's math indeed gives a pretty smooth response when i use a compression chamber. But I can't work with a very low Fc because i don't have very much space...
Centauri said:Whoah! You have MMD at 0.05 - this is too low. Maybe you typed in measurement for kg, which means this should be 50.
Thanks! I didn't notice that 🙂
I tried some different throat areas, cutoff frequencies and horn lengths, but there are still dips and peaks. Is that normal for a back loaded horn, or do i make mistakes?
Only an infinite horn wont have FR abberations, try 0 in the ANG box,that should be an infinite horn.
The throat size and Vtc probably need a large change when modeling BLH instead of front loaded,rear sealed horns.
The throat size and Vtc probably need a large change when modeling BLH instead of front loaded,rear sealed horns.
Consider also that room modes will cause frequency response errors of up to +-20dB. Probably less ,but you wont know til you try. Therefore dont fret over +-0.5dB ripple on the basshorn model.
- Status
- Not open for further replies.
- Home
- Loudspeakers
- Multi-Way
- Hornresp simulation

