I spent half an hour trying to find out what Max SPL is actually showing. First I assumed it shows the output at a certain wattage and colors the response graph red when you exceed xmax. But when I enter 1watt in the max SPL tool the response doesn't at all correspond to what i initially modelled.
My initial modeling output:

Max SPL at 1 watt...........why doesn't it resemble the previous graph???? :

Also there always seems to be a huge peak around 30Hz in the max spl graph whatever enclosure type I model while the modelled response graph is flat....
My initial modeling output:
Max SPL at 1 watt...........why doesn't it resemble the previous graph???? :
Also there always seems to be a huge peak around 30Hz in the max spl graph whatever enclosure type I model while the modelled response graph is flat....
I did read the thread "What does the Maximum SPL tool in Hornresp show?" and still don't understand how to use/interprest the maxSPL tool.
Why should it? The 1 W moved it some small amount down below its upper mass corner (Fhm = 2*Fs/Qts') where T/S theory peters out whereas the rest of its HF BW is governed by its inductance.
(Qts'): (Qts) + any added series resistance (Rs)
edit: the peak is where the box is tuned.
(Qts'): (Qts) + any added series resistance (Rs)
edit: the peak is where the box is tuned.
Last edited:

Sorry, but I am not very well versed in the theory and the technical terms and abbreviations.
Could you explain it in more layman terms?
When you model a speaker in Hornresp you end up with a hopefully reasonably flat or otherwise useful response graph. The response graph predicts what the output of your speaker will be when driven with one watt of power. Is that right?
Then I go to the max spl tool and enter one watt of amplifier power. I would expect the exact same graph. If I built what I modeled what would be the real life output? Would it have the peak at 30hz or would it look like the first graph?
I modeled a closed box here..... do closed boxes have a tuning?edit: the peak is where the box is tuned.
The peak does however corresponds with the driver Fs
The response graph predicts what the output of your speaker will be when driven with one watt of power. Is that right?
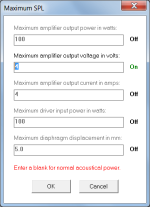
The standard power response chart is calculated assuming a constant input voltage Eg, not a constant power.
To make the power response and maximum SPL charts identical, set Eg = 4 volts (for example) on the main input parameters window, and use the input settings shown in the attachment for the maximum SPL chart.
Attachments
I spent half an hour trying to find out what Max SPL is actually showing.
Attachments
If I built what I modeled what would be the real life output? Would it have the peak at 30hz or would it look like the first graph?
If a constant voltage source amplifier is used to drive the loudspeaker (which is normally the case) then it would look like the first chart.
Until heat builds up and voice coil resistance goes up, electrical damping would go down (Qts up) and there would be some peaking around resonance 😉


It takes quite a lot of heat to double up resistance. Nevertheless, a phenomenon which makes the system aligment / response differ from simulated.
https://www.stereophile.com/reference/1106hot/index.html
It takes quite a lot of heat to double up resistance. Nevertheless, a phenomenon which makes the system aligment / response differ from simulated.
https://www.stereophile.com/reference/1106hot/index.html
Last edited:
OK, that is at least reassuring.If a constant voltage source amplifier is used to drive the loudspeaker (which is normally the case) then it would look like the first chart.
So now for my layman understanding I need to get a feel for how to interpret the max spl tool. I entered maximum amplifier power, driver xmax and as maximum driver input power I entered the driver RMS rating. Between 40 and 60 hz the driver exceeds xmax.
So in the range of 30 to 100 hz, what is the max SPL for this speaker. Is it 115 db,119db or 123db?
Thanks everyone for helping me with my questions, it is greatly appreciated.
It is 125 dB. But that is a quantity of your decibels. What is the quality of these decibels is not shown here. 🙂 I mean, long before you reach these limits your ears will tell you that there is some problem coming. Distortion levels with increased power would be much more useful to show you limits of your speaker.
It would be good that you study distortion graphs at Hificompass site. He measures distortion on few voltage levels and is showing distortion trends with increased power. Interesting things are happening under 100 Hz, even for very big and expensive speaker units....
What kind of speaker you modelled here? If it is very small it will come to physical limits very quickly, even with low power levels....but it will not come close to 125 dB, that is reserved for very big constructions....
You're welcome!So in the range of 30 to 100 hz, what is the max SPL for this speaker. Is it 115 db,119db or 123db?
Thanks everyone for helping me with my questions, it is greatly appreciated.
In theory it's 115 dB from 30 Hz - up, the rest is its variable available dynamic headroom, but what if there's a +30 dB transient at 80 Hz or even just a +12 dB sustain that heats up the VC, raising the driver's effective Qts'/box alignment Q?
The driver typically can't handle it unless accounted for, i.e. design for lower or higher average or most often is the amp clips because it wasn't accounted for, which in turn 'ripples' up the BW to maybe be audible distortion or at least a 'can't quite put your finger' on something 'wrong' about the performance.
Thanks GM! That was a good explanation. So if I understand correctly, within the frequency range of interest the max spl is the lowest point of the graph within that range. But it only accounts for "avarage spl", not dynamic peaks.........so use the graph conservatively.
Sorry, but I am not very well versed in the theory and the technical terms and abbreviations.
Could you explain it in more layman terms?
Why should it? The 1 W moved it some small amount down below its upper mass corner (Fhm = 2*Fs/Qts') where T/S theory peters out whereas the rest of its HF BW is governed by its inductance.
Hmm, all I see left is Fhm, which its math combined with it being the HF limit of T/S theory makes it mostly self-explanatory, i.e. it only covers the driver's acceleration bandwidth (BW), which at some HF point the driver's summed masses 'stall' it out and controls its nominally flat BW till its inductance rolls it off.
Maybe for some, more easily understood from a horn loading POV along with all the extra math (pg. 7):
http://www.xlrtechs.com/dbkeele.com/PDF/Keele (1977-05 AES Preprint) - LF Horn Design Using TS Paras.pdf
T/S Explained
T/S Equations and how each one affects the others
Last edited:
I do agree that one doesn't want to run speakers near their limit if fidelity is called for. But the graph is very useful in comparing different models and drivers. However I don't think my graph shows a max spl of 125. As I understand it now the graph shows the limit at each individual frequency and why it is limited. driver power handling, amplifier power or exceeding xmax.........basically "how loud does it get playing a frequency xxHz sinewave and what stops it from playing louder?"It is 125 dB. But that is a quantity of your decibels. What is the quality of these decibels is not shown here. 🙂 I mean, long before you reach these limits your ears will tell you that there is some problem coming. Distortion levels with increased power would be much more useful to show you limits of your speaker.
It would be good that you study distortion graphs at Hificompass site. He measures distortion on few voltage levels and is showing distortion trends with increased power. Interesting things are happening under 100 Hz, even for very big and expensive speaker units....
What kind of speaker you modelled here? If it is very small it will come to physical limits very quickly, even with low power levels....but it will not come close to 125 dB, that is reserved for very big constructions....
I can't even remember what I exactly modelled......probably a 15" tapped horn. I am first trying to get some deeper understanding of Hornresp before I model the bass section of some rather ambitious omnidirectional speakers....trying to get the best compromise between bass extension, distortion, power handling and space. I am trying to get the best and loudest clean bass down to 27hz in max 300L of space with 2 opposing drivers to minimize resonances.
But maybe my bass reflex aversion is making my life unnecessarily complicated. It is possible I think I don't like it because most boxes are usually too small? I remember 30 years ago a friend if mine having the best sounding speakers....giant vintage bass reflex JBLs.
Maybe a 18" woofer in a 300l br box is all I need.....
Maybe a 18" woofer in a 300l br box is all I need.....
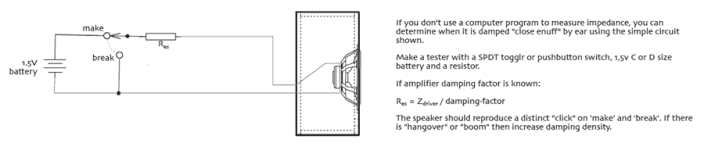
Are you incriminating my amplifiers? 🙂 (and my Kali powered studio monitors)Partly; IME really need to know the history of sound reproduction to understand all the 'ifs and or buts' of speaker design, but pretty sure all 'your' bad sounding BRs would be at least pleasing 'enough' if critically damped.
As I understand it now the graph shows the limit at each individual frequency and why it is limited.
Correct.
- Home
- Loudspeakers
- Multi-Way
- Hornresp confusion