I'd like to see how close (far) a design using simulated data is (design without measurement) to one with actual data. The problem is, I have seen the actual data and don't think I could design a crossover with the simulated data without at least subconsciously accounting for some of the differences that I have seen.
For anyone interested, help me simulate a crossover using the attached simulated data. This a a two-way with a 6-1/2 paper cone woofer and a 1" silk dome tweeter. The data incorporates the diffraction model for the baffle, but is on each driver's axis. So, you will need to use minimum phase data, set the woofer at -165mm y-offset and something like -18mm z-offset. [Tweeter data is .frd and merged woofer data is .txt] Traced tweeter impedance and simulated in-box woofer impedance are also in the zip file.
For anyone interested, help me simulate a crossover using the attached simulated data. This a a two-way with a 6-1/2 paper cone woofer and a 1" silk dome tweeter. The data incorporates the diffraction model for the baffle, but is on each driver's axis. So, you will need to use minimum phase data, set the woofer at -165mm y-offset and something like -18mm z-offset. [Tweeter data is .frd and merged woofer data is .txt] Traced tweeter impedance and simulated in-box woofer impedance are also in the zip file.
Attachments
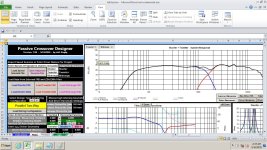
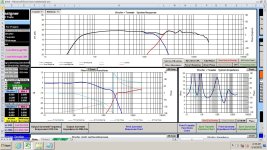
I had trouble making an frd for the woofer, but eventually did. This is using the on axis measurements. I made two sims, with different x-over points. Do you want to see the x-over, or just see if it could be done?
Attachments
Last edited:
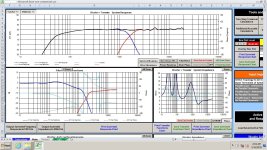
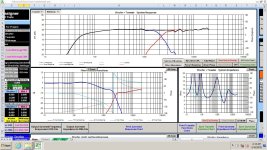
As an example as how tricky this task could be, here's my well trodden-out comparison of Paul Carmody's "Classix II" speaker, comparing my Xsim model based on supplied (Dayton DC160-8) and traced (Vifa BC25TG15) data, with Paul's real world measurements, using the same XO components. The first graph is the sim.
If I just looked at the first graph, there's no way I'd consider building it and if I tried to change values to get a smoother graph, it would likely sound poor.


HTH
Geoff
If I just looked at the first graph, there's no way I'd consider building it and if I tried to change values to get a smoother graph, it would likely sound poor.
HTH
Geoff
I had trouble making an frd for the woofer, but eventually did.
Isn't all you had to do is change "txt" to "frd"?
Oh, I'd like to see the crossovers please. I'm hoping others will simulate and I'm going to collect them and (1) drop your xo into the real in-box, with accurate phase, measurements and show how different they come out, and (2) maybe even assemble the xo and measure it in the actual speaker.This is using the on axis measurements. I made two sims, with different x-over points. Do you want to see the x-over, or just see if it could be done?
You can do this right away, right? It's like a game. Send me the results, an I'll see if I can adjust without seeing the actual files.Isn't all you had to do is change "txt" to "frd"?
Oh, I'd like to see the crossovers please. I'm hoping others will simulate and I'm going to collect them and (1) drop your xo into the real in-box, with accurate phase, measurements and show how different they come out, and (2) maybe even assemble the xo and measure it in the actual speaker.
You need more info abou the speaker than the frd and zma to make a crossover. I would need at least also the driver layout and size to make a sim, otherwise it's just useless and i won't even try. I f you don't know how they relate physically to each other you can't make a crossover as you can't know if they are phase aligned in that position. You need (to use the virtuixcad terms) the x, y and z axe distances at least
^"I would need at least also the driver layout and size to make a sim"
Yes, that is why it was included in post #1.
This a a two-way with a 6-1/2 paper cone woofer and a 1" silk dome tweeter. The data incorporates the diffraction model for the baffle, but is on each driver's axis. So, you will need to use minimum phase data, set the woofer at -165mm y-offset and something like -18mm z-offset.
I may be doing the text to frd conversion the hard way. Maybe someone can clarify. I have a second frd problem with some Parts Express frds that contain text at the top. This may be an issue with PCD. The text files here have the headings on the top. I have to remove them to make things work.
I tried renaming a file, and changing it to frd. That alone does not seem to work.
I tried renaming a file, and changing it to frd. That alone does not seem to work.
- Home
- Loudspeakers
- Multi-Way
- Help me design a passive XO with simulated data