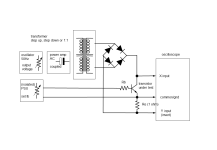
As mentioned in the JLH thread, here is a block diagram of the method I have used to set up curve tracing using a standard oscilloscope.
The idea is straightforward but has several blocks. An oscillator is set to 50Hz and drives a power amplifier which is A.C. coupled and stable when operating a highly inductive load. The ouptut level control on the oscillator is used to adjust the voltage applied to the transistor under test.
A transformer is used which in my case is a 50W split bobbin with 115+155 and 25+25V windings. The terminals are all accessible (the primary by a voltage selector switch and the secondaries by separate 4mm connector sockets) so that the unit can be connected as step up (so giving a maximum output approaching 200V AC) or step down (up to about 5V output from the PA at 20V output using the 115V input option and secondaries in parallel (can test at up to about 5A) or 10V at 2-3A) or 1:1 using one secondary as the input and the other as the output. The amplifier is a 50W 8 ohm unit.
The transformer output is bridge rectified and connected to the transistor under test. This is arranged with an emitter resistor of 1ohm (can be 10 or 100 for low current devices or 0.1 ohms for high current) with the emitter connected to ground so that the oscilloscope common can be earthed (many scopes don't accept the screen voltage at anything other than earth).
The base current for the transistor is supplied from a separate power supply which is variable (I use 0-12V) and a suitable current limiting resistor, usually with an ammeter connected in series to measure the actual base current.
The oscilloscope is set to X-Y mode. The X input is taken from the collector. The Y input from the negative of the bridge rectifier/ emitter resistor connection and as that would give a negative reading with the emitter common, the Y channel should be inverted to make an NPN characteristic look correct.
The transistor should be mounted on a heatsink. A typical error is for self-heating to change the characteristics which may give pessimistic readings for the Early voltage for example if the gain increases when warming up. Therefore, I never use the unit in continuous running mode, but wind the voltage up and down using the level control on the oscillator to provide a sweep just long enough to photograph. By stacking several images a set of curves can be obtained.
Obviously, the problems of looping , and high frequency oscillation are practical effects which need to be considered. Looping can be minimised by the standard methods (search the web if you don't know this) or simply averaged in Excel for example if you can get digitised data. Oscillation can occur with high frequency transistors and that needs to be addressed by careful wiring, or possibly by shunt RC snubbers to keep the collector impedance low but excluded from the transistor measurement wiring (i.e. across collector to bridge rectifier negative).
For PNP, all polarities are reversed.
Attachments

A couple of images from my curve tracing setup.
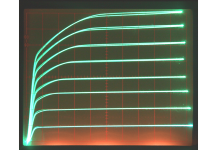
First - series of base current steps. Vertical 20mA/division horizontal 0.5V/div.
Base current approx. 0.1mA so the gain is pretty flat at around 160. Top curve is 160mA.
Clearly shows quasi-saturation. Hard saturation voltage looks quite low, so I would conclude that this 2N3053 (recent purchase) is not made on the same process as RCA's original, which had a high Vce(sat). Hardly likely to be as that process is probably long gone.
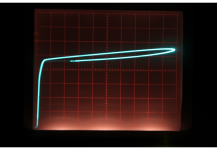
Second - same device at 100mA but 5V/div horizontal, showing that the breakdown voltage is at least 45V, meets spec.
Peak dissipation 4.5W, device on heatsink!
First - series of base current steps. Vertical 20mA/division horizontal 0.5V/div.
Base current approx. 0.1mA so the gain is pretty flat at around 160. Top curve is 160mA.
Clearly shows quasi-saturation. Hard saturation voltage looks quite low, so I would conclude that this 2N3053 (recent purchase) is not made on the same process as RCA's original, which had a high Vce(sat). Hardly likely to be as that process is probably long gone.
Second - same device at 100mA but 5V/div horizontal, showing that the breakdown voltage is at least 45V, meets spec.
Peak dissipation 4.5W, device on heatsink!