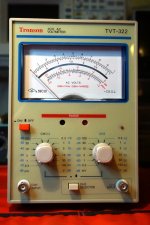
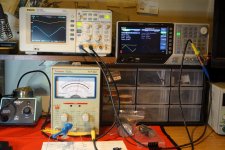
I bought an “AC millivolt meter” from a Hong Kong eBay dealer for $100 (plus $40 shipping). I got it for testing a low current shunt regulator I've designed, but no doubt it will have other uses too.
It has 2 channels, with BNC inputs. Correspondingly it's meter has 2 needles, 1 for each channel. It says it displays the RMS amplitude of the input signal, and has a bandwidth of 10Hz to over 1MHz. The sensitivity of each channel's independently adjustable from 0.3mV FSD to 100V FSD in 12 settings, alternating 3s and 1s.
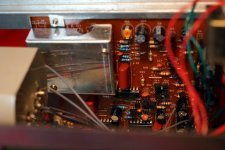
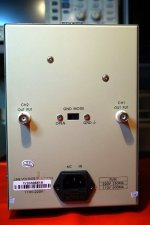
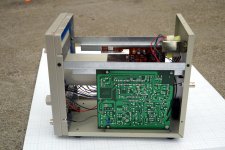
Sensitivities below 100mV FSD amplify the AC signal before passing it on for display on the meter. The maximum gain (at the 0.3mV FSD setting) appears to be a little more than 300. The output of each channel's pre-amp is available via BNC connectors on the back of the device. Note to meter designers: it would be better to have all the connectors on the front.
It has 2 channels, with BNC inputs. Correspondingly it's meter has 2 needles, 1 for each channel. It says it displays the RMS amplitude of the input signal, and has a bandwidth of 10Hz to over 1MHz. The sensitivity of each channel's independently adjustable from 0.3mV FSD to 100V FSD in 12 settings, alternating 3s and 1s.
Sensitivities below 100mV FSD amplify the AC signal before passing it on for display on the meter. The maximum gain (at the 0.3mV FSD setting) appears to be a little more than 300. The output of each channel's pre-amp is available via BNC connectors on the back of the device. Note to meter designers: it would be better to have all the connectors on the front.
Attachments
When the meter arrived, I investigated it's performance a little bit to familiarize myself with the instrument. I particularly wanted to know how well its pre-amp would work with my scope for seeing very low level signals. The Rigol DS1102E's maximum sensitivity's 2mV/div. With a pre-amp gain of 300, that should go up to a bit more sensitive than 7 microvolts/div.
A Hantek signal generator always set for a peak to peak value of 1mV produced sine, square and triangle waves, which were fed to both the meter and the scope. In the oscilloscope pictures the yellow trace is direct from the signal generator, and the blue trace is the output of the meter's pre-amp. The yellow trace is always at 2mV/div, but the sensitivity of the blue trace varies -- it can be read in the data at the bottom of each oscilloscope screenshot.
It seems that with a digital scope which can average repeated waveform cycles it's possible to get a fairly clear picture on the oscilloscope screen. But without using averaging noise makes things much less clear. I would guess that an analogue scope would have show a similar amount of noise.
The following table shows (in mV) the meter readings obtained, and the calculated values for a 1 mV peak to peak signal.
Freq ______ Square _ Sine __ Tri ___ Sine/Square Tri/Square
1KHz ______ 0.525 __ 0.35 __ 0.275 _ 0.667 _____ 0.523
10KHz _____ 0.545 __ 0.365 _ 0.285 _ 0.670 _____ 0.527
100KHz ____ 0.544 __ 0.36 __ 0.296 _ 0.662 _____ 0.544
500KHz ____ 0.53 ___ 0.335 _ 0.285 _ 0.632 _____ 0.538
1MHz ______ 0.51 ___ 0.35 __ 0.28 __ 0.686 _____ 0.549
Average ___ 0.53 ___ 0.352 _ 0.284 _ 0.663 _____ 0.536
Calc. RMS _ 0.5 ____ 0.353 _ 0.289
Calc. MM __ 0.5 ____ 0.318 _ 0.25
Tri = Triangle
{ How do you make a proper table on diyaudio? }
By comparing the ratios of the sine and triangle waves to the square wave I hoped to discover if it's really a true RMS meter, or if it reads the mean of the signals modulus, or something else.
Definitions:
RMS = Root Mean Square
MM = Mean Modulus (modulus(x) = if x < 0 then -x otherwise x)
1mV peak to peak => a = 0.5mV (a = amplitude = half peak to peak)
RMS(sine) = a/sqrt(2), MM(sine) = 2*a/pi
RMS(square) = a, MM(square) = a
RMS(triangle) = a/sqrt(3), MM(triangle) = a/2
So the following ratios hold:
RMS(sine)/RMS(square) = 1/sqrt(2) = 0.707
RMS(triangle)/RMS(square) = 1/sqrt(3) = 0.577
MM(sine)/MM(square) = 2/pi = 0.637
MM(triangle)/MM(square) = 1/2 = 0.5
But the measurements say
Measured(sine)/Measured(square) = 0.663
Measured(triangle)/Measured(square) = 0.536
So it seems to be reading somewhere between what an RMS meter would read, and what an MM meter would read! So it goes ...
Attachments
Interesting! Thanks for posting.
Hey wait a minute, who did my soldering iron and tip cleaner get on your bench.
Hey wait a minute, who did my soldering iron and tip cleaner get on your bench.
Hey wait a minute, who did my soldering iron and tip cleaner get on your bench.
Just be grateful my signal generator didn't sneak it's way onto your bench🙂.
- Status
- Not open for further replies.