I put together a little test box which is a two channel inverse-RIAA network / attenuator including a simulated MM cartridge to give more realistic noise response:

The actual unit has the inverse RIAA network switchable so a flat response can also be obtained. At 1kHz the MM output attenuation is 40dB, the MC output attenuation 60dB.


The inverse RIAA response for the two outputs:

Slight peaking from the inductors is evident. I didn't quite meet my design values of 40dB and 60dB attenuation at 1kHz but its close 🙂
When used to test one of my phono preamp designs I measured the THD against level of the combined system:

I was worried the inductors might be adding distortion but it seems to be noise limited until the headroom runs out.
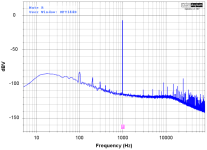
I've not seen the concept of including a model of the cartridge in such a network - I mean to graph the noise spectrum at some point (its best to do this far away from mains electricity for a cleaner trace).
The sort of plot I expect is this: (from another breadboarded test circuit)

as opposed to the more commonly seen:

The actual unit has the inverse RIAA network switchable so a flat response can also be obtained. At 1kHz the MM output attenuation is 40dB, the MC output attenuation 60dB.
The inverse RIAA response for the two outputs:
Slight peaking from the inductors is evident. I didn't quite meet my design values of 40dB and 60dB attenuation at 1kHz but its close 🙂
When used to test one of my phono preamp designs I measured the THD against level of the combined system:
I was worried the inductors might be adding distortion but it seems to be noise limited until the headroom runs out.
I've not seen the concept of including a model of the cartridge in such a network - I mean to graph the noise spectrum at some point (its best to do this far away from mains electricity for a cleaner trace).
The sort of plot I expect is this: (from another breadboarded test circuit)
as opposed to the more commonly seen: