I've been asking questions about tubes and capacitors and performance, where the answer always seems to involve "Does it meet specifications?". So, I figured I'd better check.
Tests were performed with a Scarlett Solo into a Mac Mini running Room EQ Wizard. Input voltage for all tests was ~1.76V
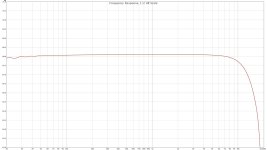
The high-frequency rolloff appears to be in the interface, as it appears in loopback measurements.
Frequency response
Manual States: +/- 0.25dB, 5Hz-30kHz
Result: 0.23dB total deviation, maximum to minimum (excluding high-frequency rolloff)
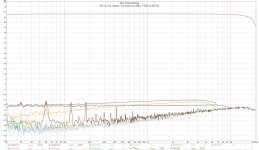
Distortion
Manual States: Less than 0.01% at 2V RMS output, 20Hz to 20kHz
Result: 0.007% THD maximum between 20Hz to 20kHz
Intermodulation Distortion
Manual States: Less than 0.002% at 2V RMS output
Result: 0.02% at 2V RMS output*
Note: Measurement was obtained using 7kHz and 13kHz twin-tone
--
I've included slides for the frequency and 2V distortion measurements. I've also included a 5v output static distortion slide for interest, although it is not relevant to any of the measurements discussed.
Thoughts: The frequency and distortion numbers seem to be inline with specifications. The IMD is high, but I don't understand the potential causes or ramifications of this enough to discuss it. For all measurements, I consider both my tools and techniques suspect, although I am making ever effort to be accurate, with the equipment I have. I allowed the amp to warm up for approximately 15 minutes before taking these measurements.
For full specifications: https://www.arcdb.ws/model/SP8
*Note: Slide for this measurement was lost
Tests were performed with a Scarlett Solo into a Mac Mini running Room EQ Wizard. Input voltage for all tests was ~1.76V
The high-frequency rolloff appears to be in the interface, as it appears in loopback measurements.
Frequency response
Manual States: +/- 0.25dB, 5Hz-30kHz
Result: 0.23dB total deviation, maximum to minimum (excluding high-frequency rolloff)
Distortion
Manual States: Less than 0.01% at 2V RMS output, 20Hz to 20kHz
Result: 0.007% THD maximum between 20Hz to 20kHz
Intermodulation Distortion
Manual States: Less than 0.002% at 2V RMS output
Result: 0.02% at 2V RMS output*
Note: Measurement was obtained using 7kHz and 13kHz twin-tone
--
I've included slides for the frequency and 2V distortion measurements. I've also included a 5v output static distortion slide for interest, although it is not relevant to any of the measurements discussed.
Thoughts: The frequency and distortion numbers seem to be inline with specifications. The IMD is high, but I don't understand the potential causes or ramifications of this enough to discuss it. For all measurements, I consider both my tools and techniques suspect, although I am making ever effort to be accurate, with the equipment I have. I allowed the amp to warm up for approximately 15 minutes before taking these measurements.
For full specifications: https://www.arcdb.ws/model/SP8
*Note: Slide for this measurement was lost
Attachments
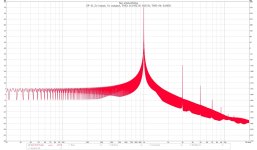
I think you forgot to specify a decent window function on the FFT - Try Hann window in the first instance, or a flattop window for accurate peak heights. I suspect that spectrum is polluted with spectral leakage from using no window function (aka rectangular window).
The IMD test is much more challenging as it involves frequency of 13kHz compared to 1kHz for the THD figure.
The IMD test is much more challenging as it involves frequency of 13kHz compared to 1kHz for the THD figure.
I'll raise this thread from the dead so I don't lose it...I'm on holiday atm and I will forget when I return.
I've recently fixed an SP-8 mk 1 and ran some REW sweeps.
One thing, from memory, the FR plot of mine is much flatter. Is yours really about 5dB down by about 18kHz?
I'll post the plots when I get home.
I've recently fixed an SP-8 mk 1 and ran some REW sweeps.
One thing, from memory, the FR plot of mine is much flatter. Is yours really about 5dB down by about 18kHz?
I'll post the plots when I get home.
I'm very interested in seeing your results chiily!
The high-frequency rolloff appears to be in the interface, as it appears in loopback measurements. I no longer have the SP-8, so I wont be able to redo my measurements to compare with what you produce sadly. I'll be curious to see if your results differ significantly from mine!
The high-frequency rolloff appears to be in the interface, as it appears in loopback measurements. I no longer have the SP-8, so I wont be able to redo my measurements to compare with what you produce sadly. I'll be curious to see if your results differ significantly from mine!