Dear diyaudio forum,
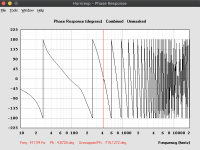
I have ended up with the following phase response for a simulation in Hornresp. I do understand the basic idea of how phase works. However, reading this graph, I have no clue how to interpret it.
The most basic questions would be: Is this good or bad? And: What is desirable in a phase response?
Many thanks,
Simon
Attachments
Dear Rayma,
Thank you for your response.
There is certainly a delay between the lower and mid/upper register since I have a vented rear chamber in the design. Could that be the cause?
Do you know how this result in the phase response will affect the sound?
Many thanks,
Simon
Thank you for your response.
There is certainly a delay between the lower and mid/upper register since I have a vented rear chamber in the design. Could that be the cause?
Do you know how this result in the phase response will affect the sound?
Many thanks,
Simon
That phase response seems due to a fixed time delay that you should subtract in the software
to get the correct phase graph. A constant time delay of say 100uS will show more and more
phase shift with increasing frequency, like in your plot. Check the software manual.
to get the correct phase graph. A constant time delay of say 100uS will show more and more
phase shift with increasing frequency, like in your plot. Check the software manual.