Assuming that we have a conical horn defined by S1, S2 and L12:
R1 = Sqrt(S1 / Pi)
R2 = Sqrt(S2 / Pi)
The radius Rx at a distance x from the conical horn throat is given by:
Rx = R1 + x * (R2 - R1) / L12
The cutoff frequency of an exponential horn is given by:
fc = m * c / (4 * Pi)
Where:
m = 2 * Ln(R2 / R1) / L12
c = velocity of sound
I simply calculated the radius values at regular distances along the conical horn axis, and then used adjacent values to calculate fc at a specific point.
To illustrate - in my Post #11745 example to find fc at a distance of 15 cm:
Given:
S1 = 15 sq cm
S2 = 6000 sq cm
L12 (Con) = 65 cm
Then:
R1 = 2.18510 cm
R2 = 43.70194 cm
Conical horn radius at a distance of 14 cm:
R14 = 2.18510 + 14 * (43.70194 - 2.18510) / 65
R14 = 11.12719 cm
Conical horn radius at a distance of 15 cm:
R15 = 2.18510 + 15 * (43.70194 - 2.18510) / 65
R15 = 11.76591 cm
Axial distance between the two = 1 cm
fc = (2 * Ln(11.76591 / 11.12719) / 1) * 34400 / (4 * Pi)
fc = 305.58 Hz
The above technique gives results that are more than adequate for the purpose. If however greater accuracy is required for some reason, then to find fc at a distance of 15 cm, calculate the two radius values at 14.99 and 15.01, with the axial distance between the two being 0.02.
Can't thank you enough, David 🙏
The attachment below compares the Danley curve for the previous example I posted using fc (Exp), against the curve generated using the generally accepted fc (Con) formula, as given by Bjørn.
David, am I correct in interpreting that exp method under predicts a conical horn's fc (allowing for 5% deviation) at around 500 Hz and the deviation reaches around 20% at 1000 Hz?
David, am I correct in interpreting that exp method under predicts a conical horn's fc (allowing for 5% deviation) at around 500 Hz and the deviation reaches around 20% at 1000 Hz?
Not sure that I understand the question 🙂.
If you are referring to the Danley curve, then as the distance between the two sampling points is reduced, the exponential cutoff frequency converges towards the conical cutoff frequency.
To illustrate:
In our previous example the conical cutoff frequency at a distance of 15 cm from the horn throat was calculated to be 297.21 Hz.
When we used the radius values at 14 cm and 15 cm (1 cm difference), the calculated exponential cutoff frequency was 305.58 Hz.
If we change the sampling distances to 14.99 cm and 15.01 cm (0.02 cm difference) the calculated exponential cutoff frequency becomes 297.21 Hz (to two decimal places), effectively the same as the conical cutoff frequency.
While the Danley curve is interesting I am not sure that it would be of much use as a multiple entry horn system design tool. As previously advised Hornresp will use the "C to E" method instead. While not perfect, it seems to give a better match to the predicted low frequency roll-off response than the Danley curve.
The attachment below compares the Danley curve for the previous example I posted using fc (Exp), against the curve generated using the generally accepted fc (Con) formula, as given by Bjørn.
Not sure that I understand the question 🙂.
If you are referring to the Danley curve, then as the distance between the two sampling points is reduced, the exponential cutoff frequency converges towards the conical cutoff frequency.
To illustrate:
In our previous example the conical cutoff frequency at a distance of 15 cm from the horn throat was calculated to be 297.21 Hz.
When we used the radius values at 14 cm and 15 cm (1 cm difference), the calculated exponential cutoff frequency was 305.58 Hz.
If we change the sampling distances to 14.99 cm and 15.01 cm (0.02 cm difference) the calculated exponential cutoff frequency becomes 297.21 Hz (to two decimal places), effectively the same as the conical cutoff frequency.
While the Danley curve is interesting I am not sure that it would be of much use as a multiple entry horn system design tool. As previously advised Hornresp will use the "C to E" method instead. While not perfect, it seems to give a better match to the predicted low frequency roll-off response than the Danley curve.
Okay. I think I understand a decent part t what you said 🙂
As previously advised Hornresp will use the "C to E" method instead.
Unfortunately, further testing has shown that ME1 and ME2 cutoff frequencies calculated using either the Danley curve (generated from the conical horn cutoff formula) or the "C to E" method, are not reliable indicators of the performance actually achieved from a practical multiple entry horn loudspeaker system. The accuracies of the calculated cutoff frequencies have been found to vary considerably depending upon the topology of the specific design being analysed. The results would be confusing and misleading to users, and certainly of no help in the design process. Based on the results obtained during this further testing, there would appear to be nothing to be gained by including the feature in Hornresp.
I don't see the point. Once you've built the model, the simulation itself tells you the cutoff frequency, indeed how efficient it is over the spectrum. You no longer need a rule of thumb, especially not one that has only marginal applicability. I'm guided by the pattern control loss frequency. I know if the mids or woofer are active below that, they will need to make up the horn gain from their headroom reserves.
Okay. I think I understand a decent part t what you said 🙂
Essentially it just means that in the limiting case when the distance between the sampling points becomes infinitesimally small, for a given conical horn, the red exponential cutoff curve on the Danley graph becomes the same as the blue conical cutoff curve.
Once you've built the model, the simulation itself tells you the cutoff frequency, indeed how efficient it is over the spectrum.
Which is why I indicated in Post #11724 not to worry about cutoff frequencies, and for ME1, to simply adjust the L12 length slider with S2 set to Auto until an optimum response is obtained 🙂.
Unfortunately, further testing has shown that ME1 and ME2 cutoff frequencies calculated using either the Danley curve (generated from the conical horn cutoff formula) or the "C to E" method, are not reliable indicators of the performance actually achieved from a practical multiple entry horn loudspeaker system. The accuracies of the calculated cutoff frequencies have been found to vary considerably depending upon the topology of the specific design being analysed. The results would be confusing and misleading to users, and certainly of no help in the design process. Based on the results obtained during this further testing, there would appear to be nothing to be gained by including the feature in Hornresp.
Essentially it just means that in the limiting case when the distance between the sampling points becomes infinitesimally small, for a given conical horn, the red exponential cutoff curve on the Danley graph becomes the same as the blue conical cutoff curve.
Conical horn cutoff accuracy is a matter of the no. of sample points(resolution). That's intuitive.
So, inspite of the method used, the simulation results don't agree with Danley's curve?
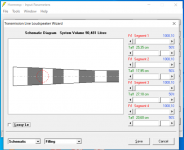
Question: in the Loudspeaker Wizard / Filling dialog, how is the percentage of filling sliders that go from 0%-100%-0% - supposed to be used? I get how the 0% to 100% is used - but how is the second half of 100% back down to 0% functioning?
Last edited:
Question: in the Loudspeaker Wizard / Filling dialog, how is the percentage of filling sliders that go from 0%-100%-0% - supposed to be used? I get how the 0% to 100% is used - but how is the second half of 100% back down to 0% functioning?
From the help:
"The Tal1 sliders can be used to partially fill segments with absorbent material. The first half of the slider fills the segment from the throat end, and the second half fills the segment from the mouth end."
Attachments
Conical horn cutoff accuracy is a matter of the no. of sample points(resolution).
When the exponential formula is used to find the cutoff frequency at a particular point, yes.
When the conical formula is used, the cutoff frequency is calculated directly, based simply on the distance from the throat.
So, inspite of the method used, the simulation results don't agree with Danley's curve?
In most cases they are not even close... 🙂.
You can quickly confirm this for yourself using the conical horn cutoff frequency formulas provided by Bjørn in Post #11750.
The first half of the slider fills the segment from the throat end, and the second half fills the segment from the mouth end.
As shown in the attachment.
Attachments
Hornresp Update 5140-210224
Hi Everyone,
CHANGE
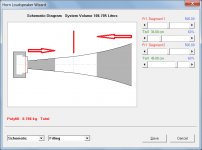
Throat port 2 in a tapped horn can now have a conical, cylindrical, exponential or parabolic flare. Selecting the zero flare cylindrical option enables throat port 2 to be stepped relative to throat port 1, as shown in the attachment.
Kind regards,
David
Hi Everyone,
CHANGE
Throat port 2 in a tapped horn can now have a conical, cylindrical, exponential or parabolic flare. Selecting the zero flare cylindrical option enables throat port 2 to be stepped relative to throat port 1, as shown in the attachment.
Kind regards,
David
Attachments

You don't give up easily, do you? 🙂.
Well, since you asked... 🙂
Schematic - no change (that shows the actual horn, not the chamber)
Schematic 1 - see attached 🙂
System Model - see attached 🙂
Hi Brian, I've been thinking about how dual offset paraflex models would look in the various hornresp system model and actually think that this could be done in a much simpler way within the existing TH model without any major UI changes, Davids implementation of AP2 opens up the possibility locating AP1 before the driver and AP2 after the driver. This would theoretically work in both the rear ported and throat ported models. So far as UX goes this could potentially be activated by double clicking Lp?
An externally hosted image should be here but it was not working when we last tested it.
Hi Everyone,
CHANGE
Throat port 2 in a tapped horn can now have a conical, cylindrical, exponential or parabolic flare. Selecting the zero flare cylindrical option enables throat port 2 to be stepped relative to throat port 1, as shown in the attachment.
Kind regards,
David
This is great! Thank you David!
Hi Brian, I've been thinking about how dual offset paraflex models would look in the various hornresp system model and actually think that this could be done in a much simpler way within the existing TH model without any major UI changes, Davids implementation of AP2 opens up the possibility locating AP1 before the driver and AP2 after the driver. This would theoretically work in both the rear ported and throat ported models. So far as UX goes this could potentially be activated by double clicking Lp?
Schematic 1 would then be essentially the same layout visually as the other Schematic diagram but with a single circle for the driver? The CSA of the port where the driver exits between P1 and P2 (S2 Equivalent) could be inferred for Con, Exp and Par and would be explicit for Cly.
Last edited:
Thomgiles, have you ever simmed a paraflex or roar, etc(time to forget names and say high order qw divisional tuning applied lengths pipe (?)using the vrc/Ap areas as the long path and tapping into the short wide path as TH and TH allow? Theres a lotta things to look at within the similar architectures of these things. Some better than others with use of in size. Removing the title and using both L12 and L45 at completely different CSA and looking beyond classic paraflex as is another pole in the fishing pond. A very big one with freah and juicy shark bait, hint hint, wink , wink
Thomgiles, have you ever simmed a paraflex or roar, etc(time to forget names and say high order qw divisional tuning applied lengths pipe (?)using the vrc/Ap areas as the long path and tapping into the short wide path as TH and TH allow? Theres a lotta things to look at within the similar architectures of these things. Some better than others with use of in size. Removing the title and using both L12 and L45 at completely different CSA and looking beyond classic paraflex as is another pole in the fishing pond. A very big one with freah and juicy shark bait, hint hint, wink , wink
This is partially why I think the addition of Ap2 and Davids specific implementation is particularly brilliant, it allows for the modelling of dual expansion, dual chamber quarter wavelength models...
Left is where we are at the moment, right is where an offset port would get us, this is a throat ported model but it should be obvious how this also translates back to the rear ported type-C model that was discussed earlier in the thread:
An externally hosted image should be here but it was not working when we last tested it.
Last edited:
- Home
- Loudspeakers
- Subwoofers
- Hornresp