Analyzing the sonographs
The LR speakers are
- 1.8m from side walls
- 2.4m between L&R
- speakers/listener are 1.3m from front/back walls
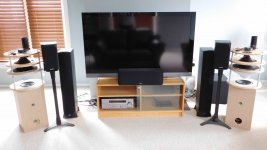
- L&R are beside a large TV and the another pair of speakers
These are the room's "fingerprints"
- first front wall refl (behind speaker) = (2*1.3m)/344m/s = T+7.5ms
- first back wall refl (behind listener) = (2*1.3M/344) = T+7.5ms
- second back wall refl (delay = 2*(3.9-1.3)/344 = T+13.4ms
- second front wall refl (delay = (2*3.9/344 = T+22.6ms
Speaker1 (Paradigm 7v5)
- conventional BR design
- exites LF room modes and they're persistant (standing wave ?)
- has MF wall reflections at 7ms, 13ms and 22ms corresponding to front and back walls
- low HF (>1KHz) reflections from other side walls (diagonal paths) from untreated room
- the double knife edge at t=1ms is from the TV or other speaker d=344*1ms=0.344m
Speaker2 (Omni)
- fires in all directions (360deg)
- only speaker to have a pronounced 7.5ms front wall bump added to 7.5ms rear wall bump
- the 13ms and 22ms bump are present but subdued probably destructive interference
- room modes are active at LF and persistent (standing waves?)
- has the most MF + HF reflections as sound is sprayed everywhere
Speaker3 (HT 5.0, LR=Paradigm 7v5, Center=CC370v4, MiniMonitorV4)
- the subwoofer is off, so its just 5.0, sorry the Subwoofer would be a give away
- the system has been auto EQ and multiple speakers are suppressing room modes
- seems to reduce the 7ms, 13ms and 22ms bumps, probably EQ and destructive intf
- more speakers running so more reflections than #1 but much less than #2
The LR speakers are
- 1.8m from side walls
- 2.4m between L&R
- speakers/listener are 1.3m from front/back walls
- L&R are beside a large TV and the another pair of speakers
These are the room's "fingerprints"
- first front wall refl (behind speaker) = (2*1.3m)/344m/s = T+7.5ms
- first back wall refl (behind listener) = (2*1.3M/344) = T+7.5ms
- second back wall refl (delay = 2*(3.9-1.3)/344 = T+13.4ms
- second front wall refl (delay = (2*3.9/344 = T+22.6ms
Speaker1 (Paradigm 7v5)
- conventional BR design
- exites LF room modes and they're persistant (standing wave ?)
- has MF wall reflections at 7ms, 13ms and 22ms corresponding to front and back walls
- low HF (>1KHz) reflections from other side walls (diagonal paths) from untreated room
- the double knife edge at t=1ms is from the TV or other speaker d=344*1ms=0.344m
Speaker2 (Omni)
- fires in all directions (360deg)
- only speaker to have a pronounced 7.5ms front wall bump added to 7.5ms rear wall bump
- the 13ms and 22ms bump are present but subdued probably destructive interference
- room modes are active at LF and persistent (standing waves?)
- has the most MF + HF reflections as sound is sprayed everywhere
Speaker3 (HT 5.0, LR=Paradigm 7v5, Center=CC370v4, MiniMonitorV4)
- the subwoofer is off, so its just 5.0, sorry the Subwoofer would be a give away
- the system has been auto EQ and multiple speakers are suppressing room modes
- seems to reduce the 7ms, 13ms and 22ms bumps, probably EQ and destructive intf
- more speakers running so more reflections than #1 but much less than #2
Last edited:
Makes sense now why the 2.5 way and surround looked so similar, the left and right are the 2.5 way! And no sub 😉
Good to see that the reflections visible in the measurement trace back to simple distances.
Which one do you prefer listening to them?
Good to see that the reflections visible in the measurement trace back to simple distances.
Which one do you prefer listening to them?
It is funny though. Even with all that you still can't tell what they would sound like. Is that a good reflection or a bad one?
What I thought was interesting about TDL is the "big picture" view of the speaker/room interaction. But by using both time and freq in the graph they give up resolution in both. I'm still not sure if something needs to change.
BTW, I consider this room to be on the "neutral" side acoustically, so spraying it with sound livens it up (to me).
Last edited:
It makes perfect sense 🙂. The graph on the Omni thread made a fool out of me. But that one was at close range (1M, I missed that part skimming for plots). Did I want the Omni to behave differently? How could it, it will splash each wall with as much strength as it does on axis.
You have a fun playground and if you like to play some more: get rid of that double peak at the high frequencies and tell us what that does for each speaker. I'm pretty sure you'll notice a difference.
This APL TDA plot is only one plot, and a useful one. What it doesn't tell us is how our brains interpret what we see in that graph. And we really should see the FR plot that belongs to the speakers to make more sense of what you get at that listening spot. Even better if we see the first wave that hits your ears and how all the reflections add to that afterwards.
At that point we can start learning.
I don't think we loose resolution with APL. On the contrary. It's a detailed plot that we don't get to see in most other measuring programs. We can interpret it from the other usual graphs but seeing it helps. What we can read in it is more difficult. Frequency response would be shown in the AFR plot as a separate item. This 3D plot is normalised so it really does not say anything about FR at all, only timing. Detailed timing as you can zoom in if you want.
We also don't see directions, the mic picks up everything that hits it. Our ears are more discriminating. Combine that with the fact we have 2 ears and even more important: a brain that sorts out whatever we hear with those two ears...
In my own case the last damping panel I put up was the one behind the listening position. It corresponded with reflections at ~6.5 - 7 ms. While I won a whole lot in clarity, I also lost something removing that reflection. I'd call it excitement. It was most prominent for me as excitement in big orchestral pieces.
It wasn't until I "created" new reflections, virtual later arriving ones from about the same angle (actually somewhat wider than before) that I got that excitement back (or at least very similar) that I lost after damping the wall. But I didn't loose the clarity!
So I won't say all reflections are bad. Which one you'd like to keep is up to each of us to decide. Keep them all and be entertained with that effect? Why not. Could you show us how even the first wave front is compared to later arriving material? That might give us some queues to learn from...
Last edited:
It was interesting to see what details people focused in on when trying to make their choice. Most people used the room modes and HF patterns to "infer" a speaker which is good. Fact is, that very few people responded at all (no opinion, no interest ?) so a thank you to all the participants. Maybe ErikSquires is on to something, maybe prizes and cookies are required 😉
I'm always willing to try an experiment or two. BTW these exercise are helpful as I get a lot of independent viewpoints and ideas that I might not have considered on my own. Hopefully its fun and interesting as well. This TDA experiment is an example.
More data coming. Same speaker sets (unidentified of course 🙂 )but a different "view".
Weysayso, I''ll remove the double knife edge, but I don't think it will make a difference as its too close (1ms) and it'll be blurred out later. I didn't even notice it till after taking the measurements and you're the only one that caught it. BTW the other close range (1m) Omni graph was meant to isolate the Omni as I try to improve it and so its deliberately measured in a position to avoid room interaction, kinda the same as most speaker specs.
Last edited:
I particularly like that type of exercise as it forces to adopt a new view on things in order to infer what we think we know.
Keep the data coming! 🙂
Keep the data coming! 🙂
Makes sense now why the 2.5 way and surround looked so similar, the left and right are the 2.5 way! And no sub 😉
Good to see that the reflections visible in the measurement trace back to simple distances.
Which one do you prefer listening to them?
Which is preferred? It depends on what I want, they are purpose specific.
I find the Omni the most natural to listen to, it never causes me ear fatigue. I think its because it creates a sound field from so many directions, especially laterally. Its musical and it fills the room. I can move around the room and enjoy the music without tone shifts and volume changes. you would never know it from those graphs but I suspect it behaves more like an acoustic instrument than a speaker.
The 2 speaker setup would be used for more technical listening where I want a better stereo image, and I'm focused on the detail. However, it restricts me to sitting in the sweet spot.
The 5.1 system can create the most enjoyable sound because it has wider sonic range and my AMPs DSP can create environments that are only possible with multiple speakers (ie. big rooms, side and back directions, deep loud freq). However, same issue, I have to sit in the correct spot because the system is focused to a small area for the best effects. However, I also play 2ch stereo in 5.1 mode where the AMP's DSP synthesizes a center channel, uses the sub and replicates on the side/back channels to "fill" the room. Less restrictive, but not as position independent as the Omni, because the conventional speakers have tone and volume change off axis.
Last edited:
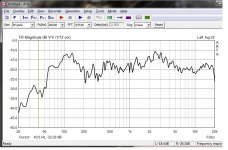
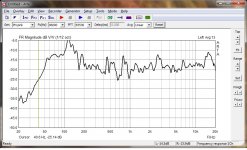
Part 2 - Frequency response
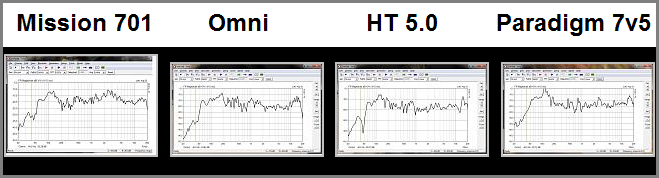
The following FR's are taken using the same setup as the previous TDA graphs. Only now, they are Freq Response curves taken with ARTA using pink noise. I've also checked using a sine sweep method and the graphs look the same. I just prefer the pink noise test as causes everything to be active.
Again the graphs are randomized you need to match the graph [A-B-C-D] to the speaker. I've tried to normalize the curves to -20db to help compare them. A special guest speaker has been added from another room. I've also added a photo of the accused, and identified them, only because it probably won't help you.🙂
The choices:
- Omni
- Paradigm 7v5
- Mission 701
- HT 5.0 : paradigm 7v5 + cc370 + Minimonitors
Attachments
Response guessing for part two : )
Thinking was... 🙄
Mission guess is based it could make sense system band pass has highest high pass point.
Omni guess is based it could make sense for upwards spraying tweeters that higest frq octave roll off so system band pass has lowest low pass point.
Then out of the two left it makes sense in that HT 5.0 was told to be without subwoofer its system band pass has highest high pass point of the two.
Attachments
Last edited:
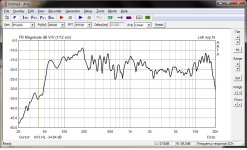
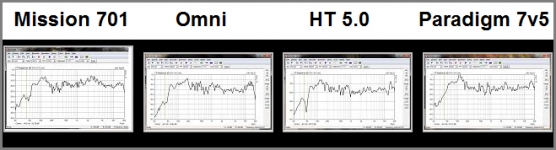
Speaker A - Omni
Speaker B - Mission 701
Speaker C - 7v5
Speaker D - HT 5.0
C and D look to have the most similar frequency response and D had the bass dip filled in and 100Hz boost from extra speakers.
B starts to roll off at 200Hz so looked more like a bookshelf.
Omni tweeter had a similar rise to A
Really hard to pick so I wouldn't be at all surprised to be completely wrong 😉
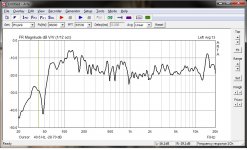
Speaker A - Omni
Speaker B - Bookshelf Mission 701
Speaker C - 2.5 way Paradigm 7v5
Speaker D - 5.1 setup playing 5.0
Kinda hoping I have the first two reversed. If the HT setup has a sub in the mix it needs fixing 😀.
Speaker B - Bookshelf Mission 701
Speaker C - 2.5 way Paradigm 7v5
Speaker D - 5.1 setup playing 5.0
Kinda hoping I have the first two reversed. If the HT setup has a sub in the mix it needs fixing 😀.
The sub is off so I list it more fairly as a 5.0 system. These graphs surprised me, as I've never measured these under the same conditions at the listening position. I even measured twice to be sure.
After I post the results, I'll post an FR for the 5.0 and a 5.1 to see the effect of the sub on the FR. I've never made that measurement so I don't even know. Hopefully it won't reveal that I've been sitting in a "null" all this time. 🙂
After I post the results, I'll post an FR for the 5.0 and a 5.1 to see the effect of the sub on the FR. I've never made that measurement so I don't even know. Hopefully it won't reveal that I've been sitting in a "null" all this time. 🙂
Last edited:
Speaker A - Omni
Speaker B - Mission 701
Speaker C - 7v5
Speaker D - HT 5.0.....
Speaker A - Omni
Speaker B - Bookshelf Mission 701
Speaker C - 2.5 way Paradigm 7v5
Speaker D - 5.1 setup playing 5.0.....
Is there a leak somewhere between Australia and Netherlands 😛
I view this as a collaborative effort anyways, it's public voting 🙂 So right or wrong is not important, its the analysis and reasons behind it.
Although "following the crowd" is not something you'd expect in a DIY forum 😉
Although "following the crowd" is not something you'd expect in a DIY forum 😉
Omni - Most midrange presence. tonal balance unlike commercial speakers.
Paradigm 7v5 (Same sig as HT from midrange upwards)
HT (Cheat since sub not properly integrated)
Mission
Paradigm 7v5 (Same sig as HT from midrange upwards)
HT (Cheat since sub not properly integrated)
Mission
Last edited:
Is there a leak somewhere between Australia and Netherlands 😛
Sure seems that way 🙂. But we get more data each step. Still a long way from being able to guess how it sounds or which one would do what.
I view this as a collaborative effort anyways, it's public voting 🙂 So right or wrong is not important, its the analysis and reasons behind it.
Although "following the crowd" is not something you'd expect in a DIY forum 😉
I didn't follow, I only looked at data available right now, the plots in the Omni thread give away that one 🙂.
The mission is the unknown, for both the 5.0 and 2.5 way we have more data so I looked at the APL graphs to determine which one to pick there.
Wesayso, I''ll remove the double knife edge, but I don't think it will make a difference as its too close (1ms) and it'll be blurred out later. I didn't even notice it till after taking the measurements and you're the only one that caught it. BTW the other close range (1m) Omni graph was meant to isolate the Omni as I try to improve it and so its deliberately measured in a position to avoid room interaction, kinda the same as most speaker specs.
It's close at 1ms but to get a speaker to disappear more easily removing hints like that works really well. Not that a reflection this close would hint directly at the speaker position, it does influence the imaging. Especially early reflections.
It might not make a huge difference for the Omni, though it will make a difference for the 2.5 way for technical listening.
Everything after ~6-7 ms is way less detrimental from an imaging point of view. The rest of imaging quality is up to left and right speaker having very similar response to get the maximum out of that imaging. (FR and Phase)
It would even be interesting to try and clean it up for the Omni as well.
I totally agree. One piece of data is not sufficient. The more of these tests I do the more I learn about acoustics, my system(s) and my preferences. Using multiple systems in the same conditions helps to remove variables and helps extract the differences. More views is more helpful.
Although I think I should have provided semi-anachoic tests @1m for all systems (not just Omni) before the room tests so we can see how the room affected an individual speaker. That is an issue.
Stay tuned :
Part 3 : Impulse Response
Part 4 : Distortion
Part 5 : any test you can think of
Although I think I should have provided semi-anachoic tests @1m for all systems (not just Omni) before the room tests so we can see how the room affected an individual speaker. That is an issue.
Stay tuned :
Part 3 : Impulse Response
Part 4 : Distortion
Part 5 : any test you can think of
I can suggest a few, can you do a frequency dependant window in your measuring software? We can compare that to the up close measurement. I'd say 5 cycles would be interesting to see. FDW still as measured at the listening position. REW is a bit (too) smoothed with it's frequency dependant windows. You're using something else, right?
Next an early waterfall plot would be interesting...
For REW I usually ask for these settings:

This can be done from a more up close position. Though it's interesting to see at the listening position as well.
After all of these we get closer and closer to a group of measurement that can tell us what to expect, sonically.
Of course to get ahead we'd need to see left/right balance too. Especially interesting with that frequency dependant window applied.
As said, the imaging decisions our mind makes are based on those first milliseconds. Tonality takes us a while longer and basically falls in the Haas limit.
So the room will play a huge role in tonality with all these speakers.
Next an early waterfall plot would be interesting...
For REW I usually ask for these settings:
This can be done from a more up close position. Though it's interesting to see at the listening position as well.
After all of these we get closer and closer to a group of measurement that can tell us what to expect, sonically.
Of course to get ahead we'd need to see left/right balance too. Especially interesting with that frequency dependant window applied.
As said, the imaging decisions our mind makes are based on those first milliseconds. Tonality takes us a while longer and basically falls in the Haas limit.
So the room will play a huge role in tonality with all these speakers.
Last edited:
- Status
- Not open for further replies.
- Home
- General Interest
- Room Acoustics & Mods
- Speaker and room interaction (pics) - your opinion