Does that mean you are considering such function?")
Hi Djim,
At this stage I am just trying to understand the significance of a 1W/1m sensitivity figure calculated at the frequency of the lowest impedance within a given "passband", and how this information can then be applied in practice. It seems to be a rather arbitrary measure in that the frequency at which sensitivity is calculated, varies from speaker to speaker.
How would the required upper and lower boundary frequencies for the "passband" be determined for a given loudspeaker?
Kind regards,
David
Hi David,
Its not I'm suggesting an average number of its sensitivity throughout the bandpass, but instead of the usual SPL plot based on voltage, I am suggesting an SPL plot based on 1Watt/1m with one click of a button.
That is the whole point. Each speaker in a system has it's own sensitivity figure, based on its impedance in relation to its load. Comparing different drivers, based on Voltage, is always in 'favour' of the driver with the lowest impedance and does not represent the sensitivity of the system. Thats why speakers are usually measured with 1W/1m or 100W/10m.It seems to be a rather arbitrary measure in that the frequency at which sensitivity is calculated, varies from speaker to speaker.
Its not I'm suggesting an average number of its sensitivity throughout the bandpass, but instead of the usual SPL plot based on voltage, I am suggesting an SPL plot based on 1Watt/1m with one click of a button.
Usually for horns the lowest impedance can be found between their 1/4 wavelength and the 1/3 wavelength of the system. Also usually this is the lowest impedance throughout the entire frequency range.How would the required upper and lower boundary frequencies for the "passband" be determined for a given loudspeaker?
Last edited:
I am suggesting an SPL plot based on 1Watt/1m with one click of a button.
Hi Djim,
Now you've really got me confused
.As mentioned in an earlier post, the Maximum SPL tool can generate an SPL plot based on 1Watt/1m.
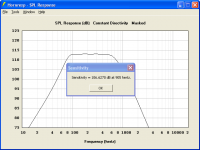
I thought however, that what you wanted was a single sensitivity figure - calculated at the frequency of the lowest impedance within a specified passband, similar to the attached screenprint.
Assuming that was the case, I was trying to understand why the sensitivity figure was required at the frequency of lowest impedance, rather than at say, the highest impedance within the passband.
Incidentally, the attached screenprint shows the result for the default Hornresp record with resonances masked. Does this value seem right to you?
Kind regards,
David
Attachments
Hi David,
Sorry David if my explanation became somewhat fussy, but it’s just the SPL plot but with a fixed 1w/1m readout.
About the question if the value seems right, is difficult to say without any info of the driver model you are using ;-)
I made an example of how it could look like to prevent miscommunication.
It would be terrific if it could be made in such way that when you turn to "Loudspeaker Wizard" that whatever change you make, it always shows the 1W/1m response in the Wizard (if chosen for Sf function) . I'm not sure if that is possible but it would be a very handy feature.
Hopefully this explains everything
Last edited:
I think what might be causing confusion is when we talk about thing in terms of constant power, we are making a useful abstraction. But in a sense, we are defining a state that doesn't really exist, since we almost always drive speakers with constant voltage, not constant power. A computer simulation can easily calculate using power as a constant, but when driven with real-world amplifiers, voltage is the constant.
As Djim said, when we make voltage the constant, then low impedance speakers get more drive current, and are therefore, louder. That's why many of us like to compare SPL with power being constant, not voltage. The problem then becomes, what frequency do we choose to measure impedance at, to know what voltage drive level to run when making our tests? Since impedance changes with frequency, what impedance do we choose? Zmax? Zmin? Average impedance? Or just use the manufacturer's advertised impedance and call it good?
Where I have run across this dilemma is when comparing hornsubs. It is much like the problem of distance - Too far away and signal-to-noise drops and/or drive level must be excessive. Too close and you're magnifying the ambiguity of the acoustic center. So how far away do we place the microphone and what drive level do we choose?
I personally like measuring at 10M/100W for powerful hornsubs, and I like using Zmin to calculate drive voltage. When testing 2000 watt subs, a 100 watt test power level isn't large enough to shift the operating point too much. It allows measurement distance to be far enough that the acoustic center can be plus/minus a few feet and it won't matter, the ratio is small enough that a few feet of wiggle room is less than a decibel. Likewise, using Zmin is measurable and concrete, and there is less than a decibel difference between a drive voltage that produces a power level at Zmin and the voltage required to get the same power level at Zavg. Zavg would take some relatively complex calculation - You would need to take the impedance curve, bring it into a spreadsheet, define the passband, find the area under the curve between the low and high frequency points and average them to get Zavg. Zmin is much easier to use, you can see it at a glance, and the decibel difference is usually like a quarter decibel. Seems less ambiguous to me.
So anyway, all that to say I think I understand Djim's dilemma. I think he is trying to use Zmin to define a "standard" drive level for comparison. In the Hornresp model, it isn't needed, since the calculations can be done with constant power. But in the real world, one will probably be driving the speakers with constant voltage, so an understanding of impedance is required.
Re Zmin @ 1w/1m
I believe it depends on the f3 of the cab. Most if not All cabs will be used with a HP filter, which along with the box fb, defines the f3. We are talking about subs here afterar all
Therefore i suggest that taking Zmin as whichever is the lowest from between f3 & the next impedance minima, could be preferable.
Without taking the HPF into consideration, the Actual real world performance might not be attained from simulation.
That is how I look at it as well. Voltage that supplies 1w into the minimum impedance in the useful pass band. This is where current is highest and the load on the amplifier is usually heaviest. With a higher minimum impedance an amplifier can usually provide more voltage before clipping at that point which can negate the apparent extra voltage sensitivity on the lower impedance cab.
Hi Djim,
In that case, as far as predicting sensitivity is concerned, I still don't understand why you just can't use the Maximum SPL tool with Pmax = 1 and Xmax = 99. Voltage Eg is automatically adjusted by Hornresp to maintain a constant 1 watt input, even though the load impedance changes with frequency.
As previously stated, the screenprint shows the result for the default Hornresp record with resonances masked. All the information required is given in the input parameter values for record 1.
Kind regards,
David
but it’s just the SPL plot but with a fixed 1w/1m readout.
In that case, as far as predicting sensitivity is concerned, I still don't understand why you just can't use the Maximum SPL tool with Pmax = 1 and Xmax = 99. Voltage Eg is automatically adjusted by Hornresp to maintain a constant 1 watt input, even though the load impedance changes with frequency.
About the question if the value seems right, is difficult to say without any info of the driver model you are using ;-)
As previously stated, the screenprint shows the result for the default Hornresp record with resonances masked. All the information required is given in the input parameter values for record 1.
Kind regards,
David
I think he is trying to use Zmin to define a "standard" drive level for comparison.
Hi Wayne,
The real issue for me is identifying the upper and lower frequency limits defining the passband of interest. Once these two frequencies are known, it is then a simple matter to find the minimum impedance over that frequency range, and to calculate the voltage necessary to deliver 1 watt into that minimum impedance.
In the screenprint example included in my earlier post, I calculated the bandwidth using the same method as used to calculate corrected phase. That is, the upper and lower frequencies are those at which the SPL is 12 dB below the maximum value. However, from tests I have done, it is obvious that the frequency of the minimum impedance can change quite significantly depending upon the assumptions made regarding the specification of the bandwidth, so I am not sure how valid this whole process really is.
Am I correct in assuming that when you do your power tests, you set the amplifier to a constant voltage to deliver a certain number of watts into a notional impedance (Zmin), knowing that as the actual impedance varies with frequency, the input power will also vary somewhat.
I guess the ideal way to do the tests would be to sample at a number of selected frequencies, and adjust the input voltage each time based on the known impedance at that particular frequency, to maintain the desired constant power.
Kind regards,
David
The real issue for me is identifying the upper and lower frequency limits defining the passband of interest. Once these two frequencies are known, it is then a simple matter to find the minimum impedance over that frequency range, and to calculate the voltage necessary to deliver 1 watt into that minimum impedance.
Yes, that's why I use Zmin, minimum impedance above cutoff. Lower cutoff is easy to define, being the 1/4λ frequency of a horn or pipe, or the Helmholtz frequency of a reflex box. This method doesn't require you to define upper cutoff or bandwidth. You can consider the upper limit to be infinity, or an arbitrarily high frequency.
How do we carry out a sensitivity measurement of a real speaker?
Do we supply a band limited pink noise, or white noise, or some other defined noise, to a speaker and measure the voltage and the current at the speaker terminals and the SPL at the test distance?
This is the way I do it:
Essentially, I take the speaker outdoors and use a swept sine to measure impedance. Then I examine the chart for Zmin, minimum impedance above cutoff. Next I calculate the drive voltage required to attain a specific reference power level. Then I set the (RMS AC) voltage drive to that reference value, e.g. 28.3v for 100 watts if Zmin is 8Ω. Then I position the microphone and run a sweep to get a response chart that shows SPL as a function of frequency. Note that 100 watts at 10 meters give the same figure as 1W/1M, i.e. 98dB@100w/10M is equivalent to 98dB@1W/1M. This is because 100w is 20dB greater than 1W, and 10M is 20dB less than 1M, so the two offset one another.
The Zmin method reduces the ambiguity of impedance, and the 100W/10M method reduces the ambiguity of the position of the acoustic center.
Hi Wayne,Since they are ¼ WL systems the 'bandpass' is between 1/4WL and full wavelength I would think.
You need an upper frequency since there are speakers with impedance compensation build in. I agree for the theoretical model that isn't necessary but this excludes those rare occasions and seems to be theoretically correct.
Last edited:
I would still use the same definition of Zmin, minimum impedance above cutoff. Seems useful for subs. You can define an upper cutoff point too, if you want, but I don't think it's necessary.
All we're trying to do is to find a consistent and reliable single-point impedance metric.
I wouldn't expect a subwoofer to have an impedance drop above the passband. Voice coil inductance makes it keep rising. Even if you hang a Zobel across it, this really just limits the rise. I can't imagine any subwoofer with a circuit that shorts the voice coil at HF. Sure would do a number on amplifiers.
I guess if you find an oddball case like that, you can deal with it as a specialized case. Probably want to limit the power from the amp at HF anyway.
Hi Wayne,I would still use the same definition of Zmin, minimum impedance above cutoff. Seems useful for subs. You can define an upper cutoff point too, if you want, but I don't think it's necessary.
All we're trying to do is to find a consistent and reliable single-point impedance metric.
I wouldn't expect a subwoofer to have an impedance drop above the passband. Voice coil inductance makes it keep rising. Even if you hang a Zobel across it, this really just limits the rise. I can't imagine any subwoofer with a circuit that shorts the voice coil at HF. Sure would do a number on amplifiers.
I guess if you find an oddball case like that, you can deal with it as a specialized case. Probably want to limit the power from the amp at HF anyway.
I agree, accept that HornResp is not only used for designing subs. Therefore I do understand why David wants an upper limit.
Well, I was talking about measurements. You are talking about mathematical models. And really, even then, Hornresp is a horn simulator, not a loudspeaker simulator. So we're sort of talking apples, oranges and cherries here. Maybe we've gone down an unproductive path.
I was just suggesting the use of Zmin for hornsub measurements. Simulations don't really need this distinction since they can calculate under an assumption of constant power. But they can also be calculated for constant voltage too. I thought maybe that's what you were looking for when you asked for calculations using the impedance minimum. Then again, maybe not.
I was just suggesting the use of Zmin for hornsub measurements. Simulations don't really need this distinction since they can calculate under an assumption of constant power. But they can also be calculated for constant voltage too. I thought maybe that's what you were looking for when you asked for calculations using the impedance minimum. Then again, maybe not.
Hi Wayne,
Sorry for the confusion but to me it was all about HornResp in the first place. I know you can already use the "Maximum SPL" function in the "Tools" menu, for finding its 1w/1m response but it can become time consuming when you are going to compare or change between different modelled designs/drivers, as I tried to explain in my post#1378.
I also tried to explain how HornResp seems to be using some sort of steps in finding its lowest impedance point for its calculation and David explained to me in post#1379 it is limited by the graphic resolution of screen pixels.
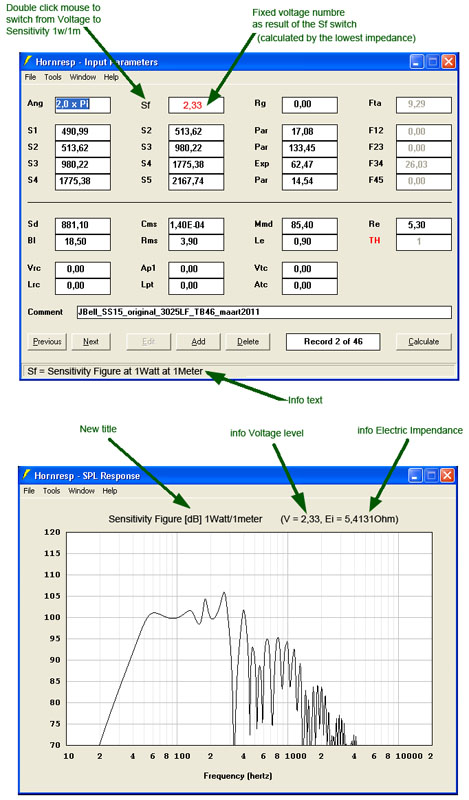
Therefore I had the idea to implement it in a fixed function in "Input Parameters" so it can be used constant with the exact lowest impedance figure (and not stepped), what I tried to visualize in post#1384. For that David needs an exact description/formula of how to find the lowest impedance. Not just for sub horns since it needs to be working uniform for all designs in HornResp.
That way you can compare with other designs and different drivers without switching between several menu's in HornResp. Now I have to use Photoshop to make all these comparisons visual in the same graph and than everybody can use it and compare their modelled designs or drivers with the "Compare Previous" function.
Sorry for the confusion but to me it was all about HornResp in the first place. I know you can already use the "Maximum SPL" function in the "Tools" menu, for finding its 1w/1m response but it can become time consuming when you are going to compare or change between different modelled designs/drivers, as I tried to explain in my post#1378.
I also tried to explain how HornResp seems to be using some sort of steps in finding its lowest impedance point for its calculation and David explained to me in post#1379 it is limited by the graphic resolution of screen pixels.
Therefore I had the idea to implement it in a fixed function in "Input Parameters" so it can be used constant with the exact lowest impedance figure (and not stepped), what I tried to visualize in post#1384. For that David needs an exact description/formula of how to find the lowest impedance. Not just for sub horns since it needs to be working uniform for all designs in HornResp.
That way you can compare with other designs and different drivers without switching between several menu's in HornResp. Now I have to use Photoshop to make all these comparisons visual in the same graph and than everybody can use it and compare their modelled designs or drivers with the "Compare Previous" function.
Last edited:
@ Wayne Parham
Hi, i'm presuming you were responding to my Post # 1386 ?
I'm surprised nobody else considers this of importance in simulation, as the DC resistance has little or no bearing on real world listening etc.
Unfortunately there is no HPF in HornResponse, or plans to include one If there was, i believe it would make a big difference to the simulations versus real world conditions. Xmax & other large signal factors, would then be more accurately portrayed. As it stands, simulations can appear less favorable than actually acheivable.
Yes, definitely. I should have been more clear. When I said "Zmin", I meant minimum impedance above cutoff, not DC resistance.
Hi, i'm presuming you were responding to my Post # 1386 ?
I'm surprised nobody else considers this of importance in simulation, as the DC resistance has little or no bearing on real world listening etc.
Unfortunately there is no HPF in HornResponse, or plans to include one
If there was, i believe it would make a big difference to the simulations versus real world conditions. Xmax & other large signal factors, would then be more accurately portrayed. As it stands, simulations can appear less favorable than actually acheivable.As far as tapped horns, the minimum impedance is usually quite close to the DC resistance, so is important when choosing an amp to drive the load.I'm surprised nobody else considers this of importance in simulation, as the DC resistance has little or no bearing on real world listening etc.
Unfortunately there is no HPF in HornResponse, or plans to include one
A simulated HPF still would not exactly predict LF excursion.
When you see simulated LF excursion rising to and above Xmax (below the Fb/Fc impedance minima) placing the HPF at around that point is a good choice for starters.
Then measure excursion on the real box and see what voltage level does what, and how low the filter can be lowered- unfortunately real world filters do not all have the same response using different DSP units.
Art
- Home
- Loudspeakers
- Subwoofers
- Single sheet TH challenge