nastorrent,
You will get same effect place a 8 ohm resistor in series with the default 8 ohm driver, find attached 4 plus 16 ohm zma file, to get real precision its much better measure driver in real situation and free REW or ARTA can do this task.
You will get same effect place a 8 ohm resistor in series with the default 8 ohm driver, find attached 4 plus 16 ohm zma file, to get real precision its much better measure driver in real situation and free REW or ARTA can do this task.
Attachments
Omnimic doesn't measure impedance (ZMA), its acoustic only.
The Dayton DATS system or the Woofer Testers (or using REW with some external parts) can get you an impedance measurement.
But to get the whole crossover fully optimal, you need both the acoustic response (with phase and proper delay relationships) and impedance. Using default impedances will get let you derive the old 'textbook' type crossovers, which are usually pretty crummy and won't be accurate but better probably than nothing.
Totally not related question!
Hello there. I am new to the this forum and I was routed here in my search for a mobile base audio measurement software. So my question is kind of not related to this posting.
I do speaker building for hobby and I have desktop based LMS and LEAP. However recently I have found the opportunity to carry on my readings in a very large carpeted church. Taking the desktop and everything associated with it is becoming burden sum. So I have been looking for a reliable measurement software that I could use with my laptop, external interface (Focus right scarlet) and could adapt to LMS's microphone another word it read the mic correction ASCII file provided by LMS.
I have researched and looked into so many applications and no success.
These are the list so you kindly do not recommend them;
Arta and Audio Tester. Both doing mostly FFT, very complicated setup and procedures and poor documentations.
I also have looked to REW and Omni Mic. the last one reads from CD and doesn't have a generator of it's own.
So with these information do you think there something out there to fit the bill or I am stuck with taking my desktop to the field.
Thanking you in advance.
Vilic.
I had a chance to try out the software and it worked out really nice and very easy and intuitive to use. I have a few questions if it's OK to ask?
1. Could we be sure about the accuracy of the simulation? I don't mean to offend.
2. What are the "mod sensitivity" and "mod delay"?
Thanks.
1. Could we be sure about the accuracy of the simulation? I don't mean to offend.
2. What are the "mod sensitivity" and "mod delay"?
Thanks.
Thank you very much for replying. I think there might be a mistake here. It seems like my question is not being viewed and probably another tread is being answered.
I was asking if anyone knows a mobile acoustic measurement software beside ARTA, REW and AUDIO TESTER that could produce sinusoidal tone sweeps across 10-40k using calibrated microphone and show speaker's frequency response in any environment.
Thanks,
Vilic.
I was asking if anyone knows a mobile acoustic measurement software beside ARTA, REW and AUDIO TESTER that could produce sinusoidal tone sweeps across 10-40k using calibrated microphone and show speaker's frequency response in any environment.
Thanks,
Vilic.
Question here...
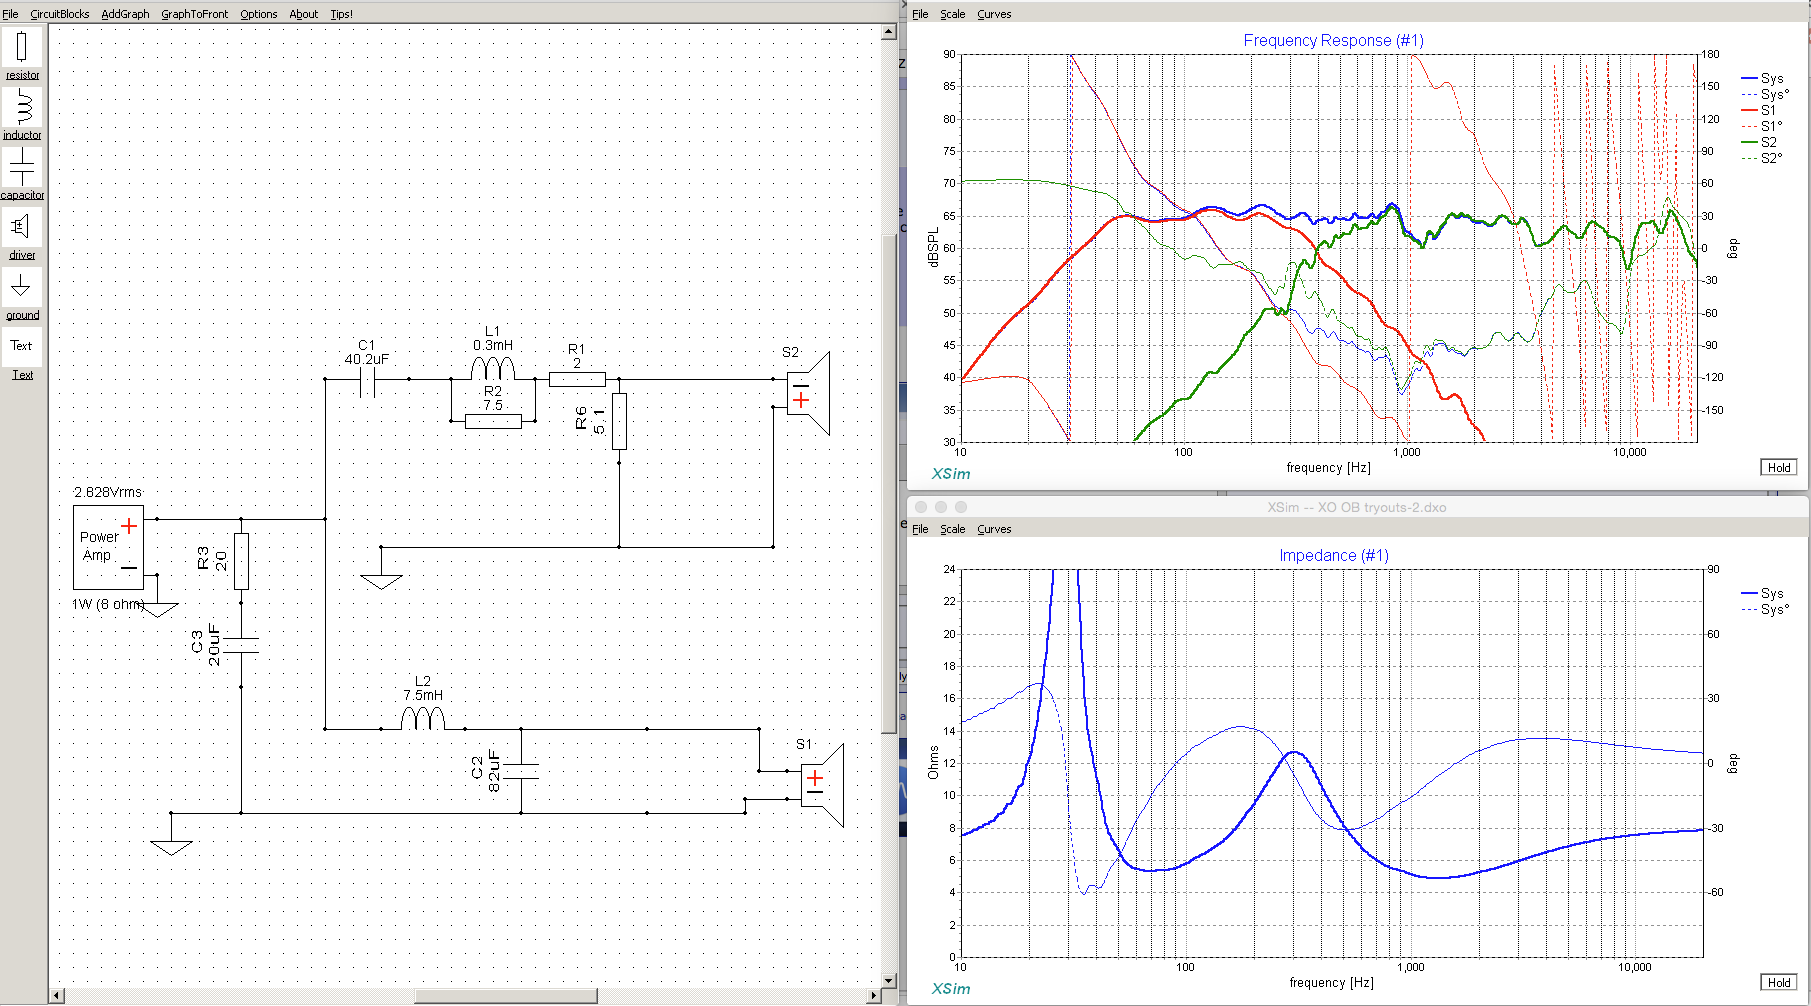
In this picture, I was suggested to add a shunt at C3 and R3, 20uf and 20 Ohms respectively.
But... I tried removing C3 and only have R3 in the shunt and it looks even better.
Can I forego the capacitor in that shunt and only use R3 to lower the impedance plot?
In this picture, I was suggested to add a shunt at C3 and R3, 20uf and 20 Ohms respectively.
But... I tried removing C3 and only have R3 in the shunt and it looks even better.
Can I forego the capacitor in that shunt and only use R3 to lower the impedance plot?
I didn't measure at 2.83V, quite less than that and it shows a lot lower efficiency than it is in reality. I think I measured when I couldn't play too loud. Didn't calibrate the mic in REW either... I'm looking at the shape of the FR, not it's efficiency.
The driver is the TB W8-1772, 95dB efficiency, and that's standard FR for that driver. It needs EQ to make it sing.
Still trying to know if I need that 20uf capacitor in the shunt, or if I can use the resistor by itself only...
The driver is the TB W8-1772, 95dB efficiency, and that's standard FR for that driver. It needs EQ to make it sing.
Still trying to know if I need that 20uf capacitor in the shunt, or if I can use the resistor by itself only...
TB W8-1772, 95dB efficiency,
The pair i measured came out at just under 92 dB.
dave
A famous Dane designer had a design posted I wanted to build but my tweeter is a Scan 2705/9500 not the 9700 in his design. He kindly modified it and sent me the plan privately.
This was 10 years ago and I still haven't built it. I finally bought all the xover parts (hundreds of dollars). I discovered this Sim a few days ago and entered all the values, traced the FR and Z curves from the ScanSpeak site correctly.... and the system response curve is appalling. It is slightly better with inverted tweeter polarity but not anything acceptable. I spent a few evenings and mostly using the same parts, in a completely different arrangement, designed a decent System response and an AMAZING System impedance curve. But what the heck with the circuit I was as given?? I hate to look a gift horse in the mouth but on no planet 10 or otherwise would that cross over have worked.
And hi Dave and welcome back!
Last edited:
I am totally enthralled with this Simulator. But prior I just built a pair of speakers using drivers sitting around for a few years that are my most successful yet. And really just by looking at the FR curves. Both are flat at my 5000hz 1st order Crossover point. Tangband 654 and the ribbon tweeters sold by CSS 8 years ago or so that were Aurum Cantus I believe.
These are a delight of soundstage imaging. Need a sub obviously but wow! The crazy un flat FR curves of the Scan Speaks need this Sim though.
These are a delight of soundstage imaging. Need a sub obviously but wow! The crazy un flat FR curves of the Scan Speaks need this Sim though.
I have downloaded and started playing with XSim. Neat tool.
I have not been able to figure out how to get the graphs that show the individual drivers frequency curves overlaid with the combined curve.
What am I missing? I will not be offended if you tell me to RTFM, as long as you tell me where to find the FM.
I have not been able to figure out how to get the graphs that show the individual drivers frequency curves overlaid with the combined curve.
What am I missing? I will not be offended if you tell me to RTFM, as long as you tell me where to find the FM.
Another learning curve question regarding this simple 1st order butterworth crossover.
The tweeter is a NEO 8 clone which supposedly has a 10Khz peak that there is a well defined notch filter for. I attempt to add the filter and it has little impact on the resulting frequency graph.
The graph also looks much nicer with the tweeter inverted, but again there is no appreciable affect in adding the notch filter.
Did I get the filter wrong?
Attachments
I didn't even see the manual so I figured it out by guess and by golly. So you have obviously drawn the crossover right? Oh I see that just now you posted it. Yes you just need to add the rest of the curves using the pulldowns. And for the drivers have loaded the FR and Z curves. The two graphs that pop up by default are the FR and Impedance(Z) graphs. The File, Scale and Curves' pulldowns are on the top bar. Use 'Curves' on the right of each graph. It has a number of options: System, S1 and S2 in my case as I have a 2-way system drawn, and S1(driver only), S2(driver only). Click on any of these you want drawn. S1 and S2 are the response curves of the Tweeter and Woofer crossover sections in my case. And System is the overall response. You can choose colours for all these curves to be different for clarity. You have to do this for both graphs.
Last edited:
ScanSpeak 8530-K00 and 2905-9500.
I attempted notch filters for the bump at about 750 Hz and saw no effect either. So I don't know ...
Both Troels and ZAph have implemented notch filters for this bump up in response so I figured I had better too. But since they appeared to do nothing to impedance or FR I removed the notch.
I attempted notch filters for the bump at about 750 Hz and saw no effect either. So I don't know ...
Both Troels and ZAph have implemented notch filters for this bump up in response so I figured I had better too. But since they appeared to do nothing to impedance or FR I removed the notch.
Attachments
Last edited:
")
- Home
- Design & Build
- Software Tools
- XSim free crossover designer