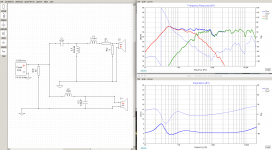
Perceval no that pair are just going to ground. But the Series X-over done for me by the Dane is absolutely incomprehensible...as is any Series crossover where the tweeter and woofer ARE in fact in series. And the response curve stinks ...
Attachments

Last edited:
The Dane's is better with the tweeter un-inverted and that must be what he intended.
Mine have 2nd order on tweeter and 2nd on Woofer, L-Pad on tweeter to attenuate it (R7 and R8), and R1 and L1 do some impedance correction like a Zobel.
Mine have 2nd order on tweeter and 2nd on Woofer, L-Pad on tweeter to attenuate it (R7 and R8), and R1 and L1 do some impedance correction like a Zobel.
Attachments
Last edited:
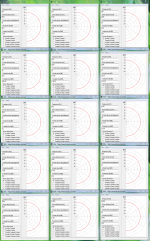
I have downloaded and started playing with XSim. Neat tool.
I have not been able to figure out how to get the graphs that show the individual drivers frequency curves overlaid with the combined curve.
What am I missing? I will not be offended if you tell me to RTFM, as long as you tell me where to find the FM.
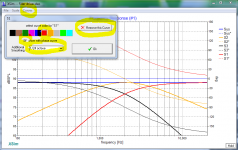
In menu "Curves" choose a driver or system sum to change their view, you can change color here enable/disable phase curve and set smoothing resolution or when toggled remove curve again.
Attachments
Thanks for the help. I completely missed those menus.
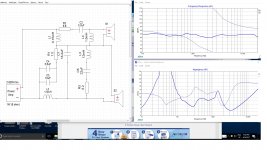
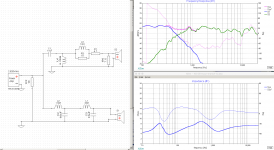
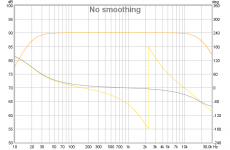
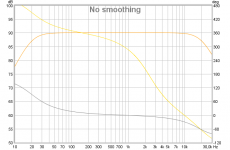
I have what I think is a decent xover, for what I am doing. The cap & inductor just coming out of the amp are to reduce load on the mid woofers, the rest is pretty straight forward.
I will be getting a calibrated microphone tomorrow, and I will see if the 12khz peak is there. If it is, I will need help taming that. This is for an OB mid tweeter sitting on top of a powered OB woofer cabinet.
I will also be adding an L-Pad to the tweeter circuit, for tweaking.
Does anyone know if there is a way to cause the two woofers to sum as one in the graph?
Attachments
Last edited:
...Does anyone know if there is a way to cause the two woofers to sum as one in the graph?
XSim is very flexible in you can have hundreds of component floating around over in circuit window and as long as they not connected or with a rightclick commanded "short"/"Open" will not influence frq response window. So in your case either pull a wire to tweeter or C1 or S3 so they are floating will change system sum to reflect mid woofers response, now over in frq response window push button "Hold" and connect components once again which will leave you with new grey "Hold" curve that represent S2/S2.
Thanks for the help. I completely missed those menus.
I have what I think is a decent xover, for what I am doing. The cap & inductor just coming out of the amp are to reduce load on the mid woofers, the rest is pretty straight forward.
I will be getting a calibrated microphone tomorrow, and I will see if the 12khz peak is there. If it is, I will need help taming that. This is for an OB mid tweeter sitting on top of a powered OB woofer cabinet.
I will also be adding an L-Pad to the tweeter circuit, for tweaking.
Does anyone know if there is a way to cause the two woofers to sum as one in the graph?
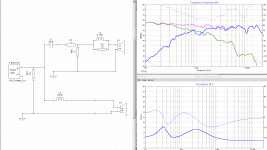
aceinc : That is a pretty crazy hump in the FR of the tweeter just over 10000. You might want to tame that bad boy!
")
BYRTT: thanks for that tip on combined drivers. Although it was meant for aceinc I will try that tomorrow on another design.
Last edited:
Thanks, I'll try...
Regarding the measurement, the problem is the mic. I'm in serious doubts on what measurement system to try. Money is a factor too.
What do you use?
What do you think about Dayton Audio Omnimic?
Thanks in advance
Have three cheap plus a higher priced microphone, honestly experience is cheap ones actual is very precise even they in hand and look feels lower quality, two are USB and two are analog. USB ones have their own build in soundcard input interface where analog HF stop-band is half of samplerate and is not in precision sync with computers soundcard output interface so to get real time of flight data for a measurement needs measurement program to have other tools build in as example REW did with their acoustic timing reference setting, where analog microphones also needs a preamp that feed phantom power. Imagine whether microphone is cheap or expensive that its calibration data is most precise buying it from company that have pro labs and do per device pro calibration, in US Cross Spectrum Labs and iSEMcon sell their own and third party cheap to expensive microphones and into EU iSEMcon do these services.
As bwaslo posted to get XSim precise reflect real world feed it frd files with good acoustic measurement of driver in actual situation and also a zma file of driver in actual situation and DATS or REW or ARTA can help get these actual in situation impedance data.
The Dane's is better with the tweeter un-inverted and that must be what he intended.
Mine have 2nd order on tweeter and 2nd on Woofer, L-Pad on tweeter to attenuate it (R7 and R8), and R1 and L1 do some impedance correction like a Zobel.
Can i polite point to that its very educational and fun for better understanding play around using XSim program, but in you posted that your frd and zma files are traced from datasheet it lacks other parameter those drivers will perform into your actual real world build, therefor if the Danes schematic is build for a specific speaker system that you supposed to build it can be it will shine there. To get XSim precise reflect real world feed it frd files with good acoustic measurement of driver in actual build situation and also a zma file of driver in actual build situation.
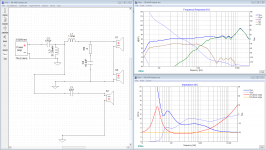
If one have enough screen pixels space then for optimal polarity and components value its possible on the fly having below three windows opened while working on circuit, find them three ones in circuit window under "AddGraph/more".
Attachments
I'm getting lost in there... so many options.
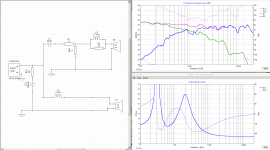
I got these 4 at the moment.
1 has the shunt with cap and resistor.
2 has the shunt with resistor only.. looks better but drops under 4 Ohms.
3 is a Harsch XO that X likes so much
4 is yet another try to get things going.
1 and 2 has a first order on the woofer, meaning I get a mot more than I would like from it at higher frequencies. It helps iron out the ragged response of the 1772, but I know the TB is just cleaner up there.
3 and 4 stop the woofer earlier, and might be better and cleaner overall.
Any pointers ?
Attachments
.....I see you wired some resistor, and resistor plus inductor between the tweeter and the woofer. What do these do?
Can this help understanding what components and their value do and what to pick next
Instead of just looking general at circuit try think yourself is the wideband AC electrical signal going down the lead out of amp and what happens when passing those components.
Capacitors pass only HF and block LF and their value regulate what point of frq pass/block happens.
Inductors pass only LF and block HF and their value regulate what point of frq pass/block happens.
Resistors normal don't filter at these frq in audio band they just lower electrical amplitude depending their value.
I see that's what is happening when wired in series, I'm just unclear when we wire them in parallel.
I'm getting lost in there... so many options.
I got these 4 at the moment.
1 has the shunt with cap and resistor.
2 has the shunt with resistor only.. looks better but drops under 4 Ohms.
3 is a Harsch XO that X likes so much
4 is yet another try to get things going.
1 and 2 has a first order on the woofer, meaning I get a mot more than I would like from it at higher frequencies. It helps iron out the ragged response of the 1772, but I know the TB is just cleaner up there.
3 and 4 stop the woofer earlier, and might be better and cleaner overall.
Any pointers ?
... pointers1 and 2 have woofer polarity reversed this means the linear phase on axis 1st order XO is supposed to perform is ruined and now add a 180º phase shift as with 2nd order although single drivers is still 90º apart in the wide XO region where with 2nd order they in phase in a less wide XO region. Think you better flip polarity for tweeter than flipping woofer because if later you add a subwoofer or want these cooperate with other HT speakers then its best that it is woofer that stroke forward when handling a positive electrcal signal.
3 looks right regarding polarity but most expensive regarding components.
4 looks middle way of these four regarding component cost and if its 2nd order LR its right having tweeter polarity reversed and it should cooperate right with subwoofers or other HT speakers.
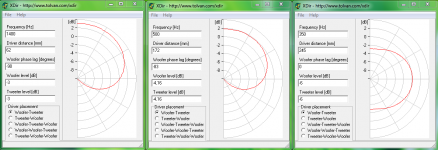
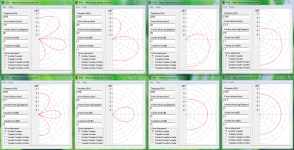
XOs that is not in phase in XO region have a tilted acoustic lobe because of physical spacing so where 1st order will sum as perfect linear phase in a electric domain now because of real world spacing for acoustic drivers we ruin this parameter and a tilted lope from wide XO region will tilt acoustic sound upward or downward depending if tweeter sits over woofer or woofer sits over tweeter, Harsch XO also have tilted lobe in XO region but in slope is higher order this tilted region is less wide. Below is example of verticals if spacing is within 1/4 wave length for example 1 and 2 with XO point 1400Hz then for 3 with XO point 500Hz and last is 4 with XO point 350Hz. In that you cant get within 1/4 wavelength spacing with a 15 and 8 incher so reality would be worse than below then i would choose number 4 because XO point is the lowest in frq and improve on the large spacing between the four examples and also better like when XO region lobe points strait forward.
I see that's what is happening when wired in series, I'm just unclear when we wire them in parallel.
Agree it gets worse but think about it as with a mixer can maybe help a bit why they sometimes sum as a band pass, capacitor filter out LF and inductor filter out HF but in their pass band overlay a little bit we get a notch when summed : )
Attachments
BYRTT,
as always, I am humbled by your knowledge and especially your willingness to share so much with us.
Thank you.
Plus, the way you explained it, I got it right away.
So, my spacing c-c between the 15" and the 8" being at 35cm... I'm much farther apart than the 1/4 wave of 500, which is 16.6cm.
I'd be better to have the XO lower than 250Hz then...
.....I'd be better to have the XO lower than 250Hz then...
Couldn't agree more the better spacing data really helps, for few days have tested 2-way within 1/8 wave length and wow when XO plus acoustic alignment is right they integrate as being one driver so good i feel in near field now can hear where there is diffraction points, downside for your setup is passive filter components costs will grow the lower the frq point so was it me i would loosely test those XO points with a DSP unit before ordering these expensive passives.
Can i polite point to that its very educational and fun for better understanding play around using XSim program, but in you posted that your frd and zma files are traced from datasheet it lacks other parameter those drivers will perform into your actual real world build, therefor if the Danes schematic is build for a specific speaker system that you supposed to build it can be it will shine there. To get XSim precise reflect real world feed it frd files with good acoustic measurement of driver in actual build situation and also a zma file of driver in actual build situation.
If one have enough screen pixels space then for optimal polarity and components value its possible on the fly having below three windows opened while working on circuit, find them three ones in circuit window under "AddGraph/more".
I agree. I would prefer to measure real drivers. And I know the baffle design was taken into account by the Dane as well which I do not know how to do.
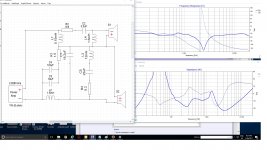
Trying to understand lobing and driver location but I am having a hard time. But the flatter curve I showed must be the one intended though correct? This one with the huge null can't work in any arrangement of drivers can it?Attachments
I agree. I would prefer to measure real drivers. And I know the baffle design was taken into account by the Dane as well which I do not know how to do.
Schematic show tweeter have reverse polarity which in theory point to acoustic XO target slope is probably 2nd order. Think
found culprit for suck out in your simulation, looks like reason is XO design takes care of acoustic off center between woofer and tweeter and maybe also a certain baffle and design axis. Below show a textbook perfect 4th order LR at 2400Hz and moving tweeter backwards or forwards about 2,8 inch creates that suck out, so your simulation will probably improve to flat somewhere when dobbelt clicking S1 and sweep "mod delay" in negative direction which will move tweeter closer to microphone relative than woofer. Also for the beautiful flatter curve showed try move tweeter forward or woofer backwards as when mounted on a flat non stepped baffle, will probably show problems.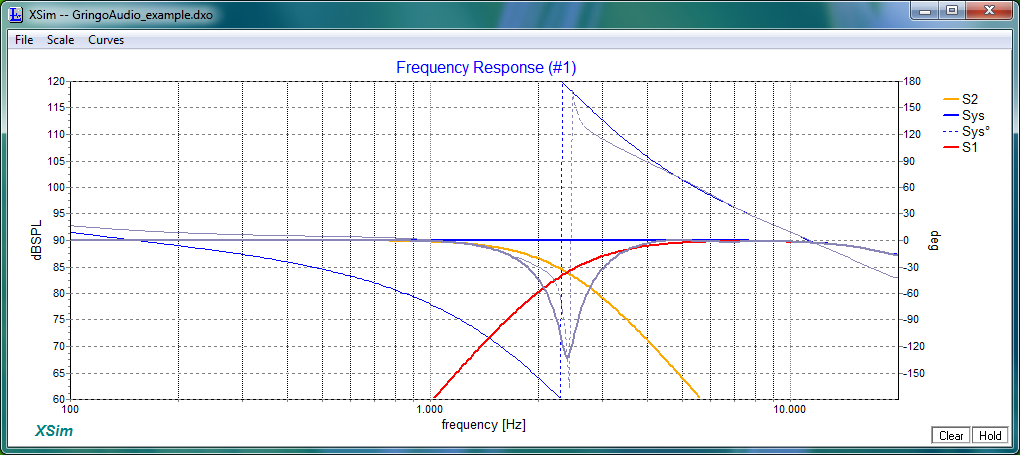
For any interested will share how to make those textbook perfect model to use for simulation in XSim or use as target response when measuring live speakers and tuning their slopes. Procedures will probably need some program practice and study but in general its very simple. First make intended band passes as minimum phase filters in free Rephase and save as IR-wav files, then import to free REW and align IR (impulse response) plus offset amplitude to about 90dB level and export as frd-files which then is pointed to for drivers into XSim and connected in parallel to power amp.
To have simulation work best and precise especially for 3-ways and up where down at lower levels more than two drivers often X and sum their slopes use system stop bands and neighbor band passes slopes for every each band pass to create, what this means is that for below 2-way was choose a system band pass as 20Hz-20kHz so in Rephase tweeter was created with one low pass 20kHz BW2 (system stop band) and one high pass LR4 (XO point) and one high pass 20Hz BW2 (system stop band), and woofer was was created with one low pass 20kHz BW2 (system stop band) and one low pass LR4 (XO point) and one high pass 20Hz BW2 (system stop band). Over in REW sharp IR for tweeter is easy to align with "Estimate IR delay" and use same procedure for mids and woofers too but often especially woofers soft IR needs some small bit manual alignment which is set right when phase curve exactly follows phase curve for tweeter and can be tweaked with overlay window open while changing timing for IR.
Attachments

Last edited:
Wow. X-Sim in my naive hands is a dangerous tool. Thank you. I know he is the best speaker designer/builder out there from all accounts. I was just wondering if there was an error. I do have a flat baffle.
Now I want to try a bunch of different x-overs and actually listen to them.
I cant see that my tweeter coil is almost 3" ahead of the woofer though.
Another thing .. can you explain the significance of the frequency of the discontinuity of the phase seen of some graphs. My Xover design didn't show this phase discontinuity. It did show up around 150000hz when I moved the tweeter back half an inch though.
Last edited:
...
Forgot this part in previous post and agree have a hard time too but diyA site helps a lot to find some answers
.At www.tolvan.com find free "XDir" and he also share "The Edge" for sim of baffle step and diffraction. Into XDir fill in data taken from textbook slopes to see summing caused by spacing in vertical direction if band passes stacked upon each other as most do, below is example 1/1-1/2-1/4-1/8 wave length spacing and the upper four is uneven 1st order and lower four is even order LR and frq is exactly at XO point, but just open it multiple times and capture screen to plot above and below XO point to see where XO region spacing errors starts become better, in general low order slope errors over wider area than higher orders. Looking those visuals think reminds why some love full rangers and some build Synergy horns to get better data because even we can sit frozen on design axis beam and enjoy, room power response have other tonal reflection than direct beam. Have observed tilted lobe when drivers not in phase in XO region for WT or TW config but WTW helps correct tilt and in past noticed LR 16th order within 1/8 wavelength is mostly stunning perfect at/over/below XO region showed in second picture below where left plot in middle is 80Hz XO point and all other plots is above and below and at 80Hz it should be possible reach within 1/8 wavelength.
Wow. X-Sim in my naive hands is a dangerous tool. Thank you. I know he is the best speaker designer/builder out there from all accounts. I was just wondering if there was an error. I do have a flat baffle.
Now I want to try a bunch of different x-overs and actually listen to them.
I cant see that my tweeter coil is almost 3" ahead of the woofer though.
Another thing .. can you explain the significance of the frequency of the discontinuity of the phase seen of some graphs. My Xover design didn't show this phase discontinuity. It did show up around 150000hz when I moved the tweeter back half an inch though.
Year XSim is excellent tool have fun creation and listening.
Not shure fully understand question for phase but in your frd file was traced from datasheet think phase is probably missing or just flat so needs either a tool to extract minimum phase curve belonging to that frq response or also think XSim can help in dobbelt click driver and in field "FRD phase source" pick "derived" and fill in HP/LP parameters creates some phase curve. At this link software Charlie Laub and Jeff Bagsby share great tools and the one called "FRD Response Blender and Minimum Phase Extractor" can extract phase for a traced amplitude curve. What you mean could also be that in XSim noticed when we move one driver forward or backwards that system phase sum becomes wiggled and not reflects textbook looks for actual system pass band, have cured this in past setting opposite delay for power amp but don't know if this is right to do but then phase starts look as predicted, and for detail what i mean is if tweeter have delay set at +1,5" then set delay in power amp to -1,5" and system curve now looks right.
Attachments
Last edited:
Your example has the phase flip or discontinuity at the null frequency. What is this discontinuity?
Think get it now flip is phase shift caused by for my example LR 4th order XO point at 2400Hz, that phase wraps is just for views in REW we can also set view to unwrap.
Look phase numbers at right and with a system pass band being 20Hz-20Khz makes sense. Grey curve is minimum phase curve for that pass band as it was one driver without XO filter and at HF 20kHz BW2 stop band turned -90º and at LF 20Hz BW2 stop band turned to +90º. Absolute real phase for system because of 4th order XO is yellow curve and adds 360º of phase shift around 2400Hz point.
This is exactly same system but with unwrapped phase view its easyer to see totally phase turn sum within stop band is (90º+360º+90º) 540º.
Attachments
- Home
- Design & Build
- Software Tools
- XSim free crossover designer