I created an LTSPICE add-on to automate THD measurements and plot result in the form of THD vs. Amplitude and THD vs. Frequency graphs.
I was inspired by "jfet_amp_disto_plot" by Helmut Sennewald, "Audio Distortion Analyser" by Tony Casey and "Fundamental Null Distortion Residual" by jcx from http://www.diyaudio.com/forums/software-tools/101810-spice-simulation-37.html#post133313
How it works:
It outputs sinusoidal signal with amplitude or frequency stepping sweep into device under test (DUT). Output signal from DUT is feed into analyzer input. After waiting some time for signal to become steady state, analyzer restores fundamental and subtracts it from input signal. This subtraction allows to increase resolution or reduce measurement time for the same resolution. You can monitor residual components at “Notch output”.
Residual signal is then fed into synchronous filters and detector. Each harmonic is filtered and measured separately. Maximum of 10 harmonics are analyzed. Amount of harmonics could be easily increased by adding corresponding filters and possessing.
How to use LTSPICE Audio THD Analyzer:
Place THD_Analyzer.asy symbol and Analyser_Controls.txt files in the same directory, where you are saving schematic (DUT schematic),
that you would like to analyze.
Put SPICE directives “.inc Analyzer_Controls.txt” and “.tran 0 {AnalysisTime} {SettlingTime} {MaxTimestep}” in DUT schematic .
Edit “Analyzer_Controls.txt“ to enable (uncomment) appropriate sweep (amplitude or frequency ) and save this file.
Setup “.param Ag=xxx” as amplitude for frequency sweep or “.param Fg=xxx” as frequency for amplitude sweep.
Run the simulation.
After simulation is complete, go to View menu and open SPICE Error Log or use Ctrl+L command.
Click with right mouse button on opened Log file.
Execute “Plot .step’ed .meas data” command. Right mouse button click on opened plot and use Add Trace or Ctrl+A and select the data that you want to plot.
You may want to double click on axis to change axis limits or switch to logarithmic scale.
Notch output shows residual components, after fundamental removal.
Please note that fundamental may not be removed completely. This is not necessarily affecting resolution of measurements as soon as additional synchronous filtering is used to measure amplitude of harmonics.
Increasing SettlingTime and StrobeLength, or (and) decreasing MaxTimestep would likely improve fundamental rejection.
Generator output is DC coupled and has 0 Ohm output impedance. Use external AC coupling and appropriate series resistor if required, to ensure proper operation of simulated circuit.
THD_Analyzer.zip contains all necessary files and example. Unzip all files in the same directory, open “Example_BJT_THD_TEST.asc” and run simulation.
You can monitor analysis progress in the left lower corner of LTSPICE window. After simulation and analysis is complete (including completion of .MEASURE), follow the instructions to display
results.
Hi Eugene,
that's going to become luxury simulation 😀
Let the computer work for a night and watch results next morning.
At least I guess that will be the way in case of simulation of class D amps.
Anyway - cool.
Still struggling a little bit with parametrization.
For some reason, when I change to the frequency sweep I see that it simulates different frequencies, but the plot in the end shows the result still as a function of the fundamental amplitude.
I guess, I missed one check/uncheck item in the text file.
Attachments


Hello,
You made all modifications correct.
To display distortion vs. frequency plot:
Double click on horizontal axis label of your distortion plot.
Put fg label name instead of Fundamental_Out_V_RMS
Set frequency limits and log scale. You may have to do this twice for log to be applied.
Eugene
You made all modifications correct.
To display distortion vs. frequency plot:
Double click on horizontal axis label of your distortion plot.
Put fg label name instead of Fundamental_Out_V_RMS
Set frequency limits and log scale. You may have to do this twice for log to be applied.
Eugene
Eugene,
Thanks for this. I have been playing around with this and it is very nice. I changed slightly how I use it. I made three versions of your "Analyzer_Controls.txt" file: One called "Amplitude Sweep, another "Frequency Sweep" and another is "No_Sweep". This way I can just have all three .inc XXXX.txt directives and comment out all but one of them. I found this easier than editing the Analyzer_Controls.txt file to change from amplitude to frequency sweep. I also like having no sweep so that I can quickly look at a transient simulation.
I of course left all of the credit information in the text files. I hope you don't mind me making the changes. This is a really nice tool. Thanks for providing it.
Terry
Hello,
You are welcome to modify it the way that is more convenient for you. I wanted to make an example of what is possible to do with LTSPICE.
Though, it is relatively slow and requires careful selection of steps for analysis. It may also require some adjustment of timing to measure very small (few ppm) numbers.
In the example you are analyzing the output(out_e) with respect to ground. Let say my signal is with respect to another node(not ground). Is there a quick trick to do this?
I am a beginner in LTSpice and tried to get this to work... unfortunately the log file shows the measurements FAIL'ed.... any ideas what could be wrong?
In the example you are analyzing the output(out_e) with respect to ground. Let say my signal is with respect to another node(not ground). Is there a quick trick to do this?
You can use voltage controlled voltage sourse with gain of 1. Inputs - to floating voltages of interest, outputs - to Analyzer input and ground.
Last edited:
I am a beginner in LTSpice and tried to get this to work... unfortunately the log file shows the measurements FAIL'ed.... any ideas what could be wrong?
Can you submit your schematic? The best way is to zip content of the whole directory, where schematic is located. It is hard to say without loking at your simulations.
Hello,
You have to place analyzer symbol on your schematic and connect it's output to your amplifier input and analyzer input to amplifier output. The same way as if you are using real measuring equipment.
I modified your schematic. It is in zip file, together with 2 plot setting file (*.plt), that you may use to display frequency or amplitude sweep results. You can also see control file example for amplitude sweep.
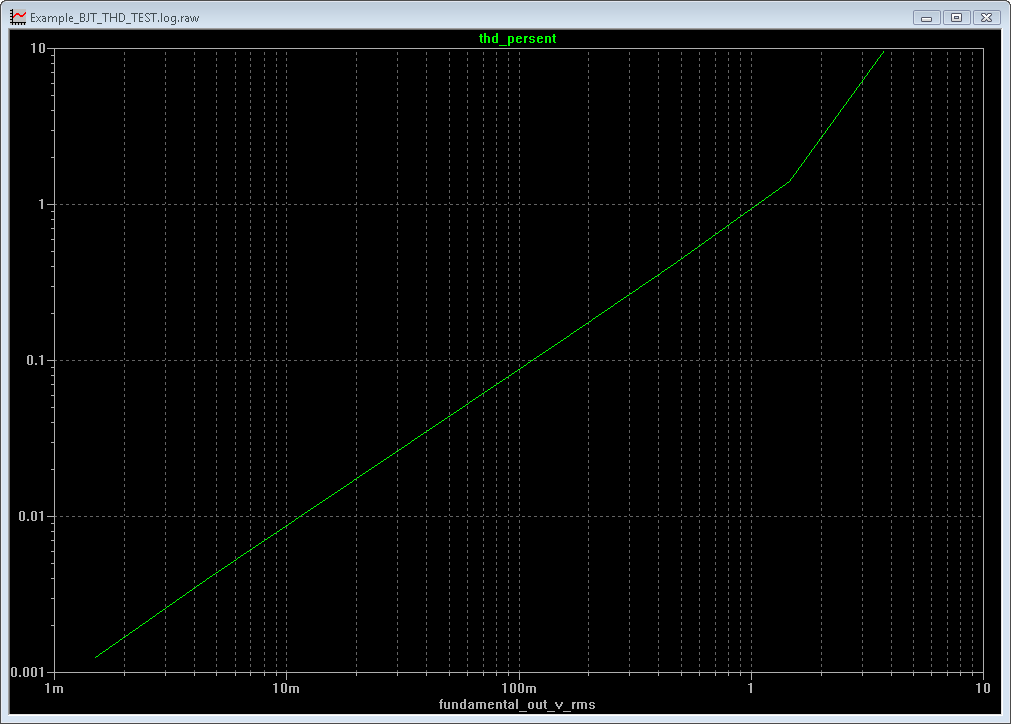
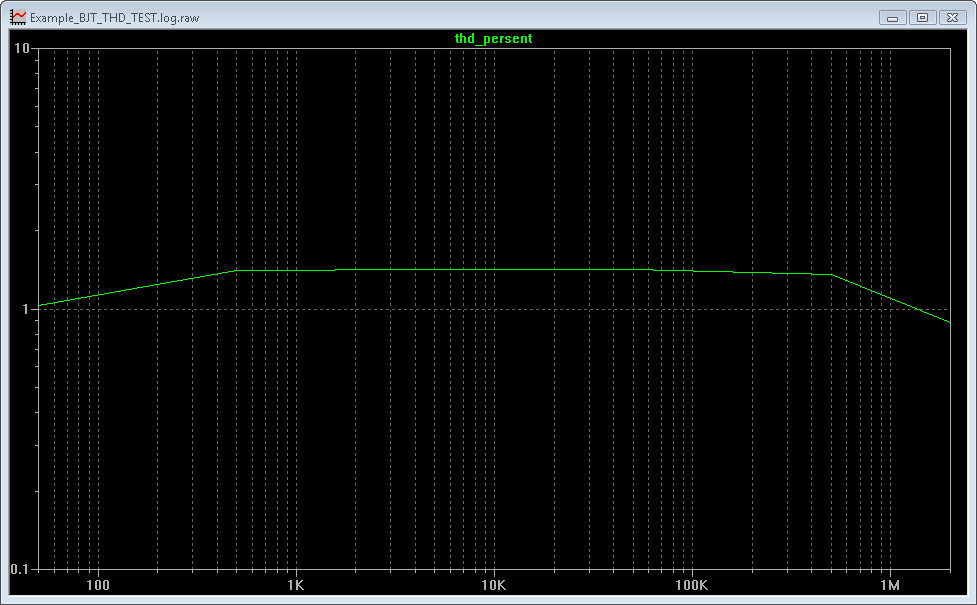
Pictures show transient plots for amplitude sweep and distortion plots for your circuit, frequency and amplitude sweeps.
Don't hesitate to ask any questions.
Eugene.
You have to place analyzer symbol on your schematic and connect it's output to your amplifier input and analyzer input to amplifier output. The same way as if you are using real measuring equipment.
I modified your schematic. It is in zip file, together with 2 plot setting file (*.plt), that you may use to display frequency or amplitude sweep results. You can also see control file example for amplitude sweep.
Pictures show transient plots for amplitude sweep and distortion plots for your circuit, frequency and amplitude sweeps.
Don't hesitate to ask any questions.
Eugene.
Attachments


Hi, Eugene,
Thanks a LOT for so excellent and useful piece of software!
I would like to ask about data representation and interpretation of graphs (please look at the picture attached). Bottom graph is the most valuable total, 2nd and 3rd harmonics.
Input voltage of DUT changes:
.STEP dec param Ag 0.01 1.0 2
What I would like to display on 3rd graph is THD% = F(V_out). Yet there is something strange. X axis starts from zero and ends with 1. Does this mean input voltage?
Then, -51 dB THD = 0.28%
Looks like Y axis (on third graph), labeled with "m", is a strange notation of THD %.
Q: Is it possible to display graph THD% = F(V_out), or better just to export data to spreadsheet and draw graph here?
Attachments

Hello,
Yes, your X axis is "ag" by default. Then 1V is your maximum setting of generator amplitude from .STEP command.
To change X axis to output RMS value, click on horizontal axis (on numbers).
You will see "ag" in the top tab. Change it to "fundamental_v_rms" and set corresponding limits in lower tabs.
In notation 280m=0.28, as soon as it is in present, 280m means 0.28%.
I was not able to figure out how to display preset notation on the scale in this case. That's why the name represents meaning.
To change X axis to output RMS value, click on horizontal axis (on numbers).
You will see "ag" in the top tab. Change it to "fundamental_v_rms" and set corresponding limits in lower tabs.
Hi, Eugene,
Thanks for feedback.
"fundamental_v_rms" doen't exists in your LTSpice script,
Did you meant "fundamental_out_v_rms"? In this case graph is displayed correctly.
BTW, did you tried to use LTSpice to predict instability problems, caused, for example, by grid leak resistor of too large value? Looks like this is working in *some* degree. Oscillation is not shown, but rather unusually low output voltage.
I would be glad to hear your opinion. Your LTSpice skills seems to be on the highest level possible.
Yes, you right. I just looked at my old script.
I'm always using LTSPICE to evaluate many kings of instability's.
I'm not very familiar with models for tubes, however your simulation is as good as your model is. You have to understand your model limitations. You also have to evaluate stability in different modes of operation, different offsets and etc. All circuits are non linear, parameters are changing. You have to make sure that your simulation covers this. Including some cases that may be considered artificial - like clipping. And that you also included parasitics.
If models are good (well, that's a common problem) I would use both AC and Transient analysis to predict possible instability.
Hi Eugene,
I'm not an LTspice expert, only pre-breadboard user mostly.
If I put the directive for power measurement and outputpower as baseline, the resulting diagarams represent amplitudes THD and Pout THD. Is it correct?
Does my setup is correct, in general.
Thanks.
I'm not an LTspice expert, only pre-breadboard user mostly.
If I put the directive for power measurement and outputpower as baseline, the resulting diagarams represent amplitudes THD and Pout THD. Is it correct?
Does my setup is correct, in general.
Thanks.
Attachments


- Home
- Design & Build
- Software Tools
- LTSPICE THD Analyzer