I have searched DIY audio for a while and only found answers that aren't right.
If anyone can point me to a good solution that would be great.
Failing that:
I came up with my own method using the Delta Vout / Delta Iout technique, but its clunky. It needs 2 identical ccts, one with no load, the other with a a 1ua ac current source load. Do an AC sweep, then plot delta v/delta i or (V(vout1)-V(out2))/1ua. Seems to work well, but doubling the cct is a pain. Want to step the current load. Does anyone no how to plot the difference between the two stepped vouts (vout sep1 minus vout step2 )?? I will keep looking.
You can use a voltage controlled switch driven by a pulse train to get your step load. I don't think you can set switch resistance to Zero, but maybe really small.
You can use a voltage controlled switch driven by a pulse train to get your step load. I don't think you can set switch resistance to Zero, but maybe really small.
I run 2 sims (.step). First one current source =0a second time 1ua (could be anythig as long as it dosnt over load the cct.) i had trouble finding the @ sign which specifies the step.
AC sources in .AC analysis never "load the circuit" - there is no "sim" going on, the cirucit is linearized around the DC operating point claclulation's output DC bias points
after that the Laplace transfer function is evaluated - you can put in Meg A and other than the scale there is no difference in the FR curves
so just use 1 A, V in AC sources to simplify reading the plots
you can also check at spot frequencies, or .step frequency of test sources in .TRAN - then you do need to pay attention to ciruit limits - but the same (sine) source can have an AC value of 1 A
Last edited:
For LTSpice newbs, the full description of my easy way is this:
Connect a current source with current flowing from ground to the node of interest . Right click on advanced for the current source and set AC amplitude to one in the box for small signal AC analysis.
Then run an AC analysis, and click on the node of interest. The default display shows a value in decibels. But go over and click on the Y axis, then select "linear". It will now show a frequency plot in volts. But because you're injecting current to the node, each volt you see here corresponds to one ohm of output impedance. Done.
For LTSpice newbs, the full description of my easy way is this:
Connect a current source with current flowing from ground to the node of interest . Right click on advanced for the current source and set AC amplitude to one in the box for small signal AC analysis.
Then run an AC analysis, and click on the node of interest. The default display shows a value in decibels. But go over and click on the Y axis, then select "linear". It will now show a frequency plot in volts. But because you're injecting current to the node, each volt you see here corresponds to one ohm of output impedance. Done.
THEN, right-click on the voltage's heading at the top of the plot and add /I(I1) , with whatever your current source's name is in place of I1, and the vertical axis will display OHMS, with actual Ω symbols.
Cheers,
Tom
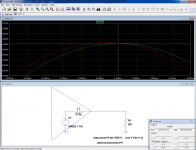
I just followed these steps, and have got some unexpected results. So obviously I have done something wrong...
1 amp current source across output,
AC analysis from 1 to 40000 Hz
Getting results in the kilovolts, kilo ohms. The plot is not actually what I expected either so has anyone got an idea as to why this might of happened?
Only just started using this software so I am sure I have missed something, but any advice would be great.
Thanks
Attachments
Bob C suggests a similar technique but with the addition of a series resistor with the voltage source, the resistor being "high" in relation to the expected output impedance. Not sure how that would pan out for valve stuff.
There is an LTspice example showing this on Bobs site, the examples all accompany the book.
There is an LTspice example showing this on Bobs site, the examples all accompany the book.
That doesn't look right, to me. Maybe try the i1 source in series with the load resistor. That would be more like what happens when the circuit is operating. Otherwise, maybe try replacing the load resistor with the current source. Also, you would need to replace the V2 input source with a low resistance (the actual source resistance), or something other than an AC source, while trying to measure the output impedance using an AC source. [If you really wanted to leave it as you have it, you would want to put a tiny resistance, like 0.000001 Ohm, in series with the output (in series with and after C1), and use that current rather than I(i1), because I(i1) is not currently the output current, because of the Load R taking some of it. But you still would not want an AC source also at the input.]
I think that I would first replace the input source with an appropriate resistance and try it with everything else as you had it. Then change (only) the current source to be in series with the load and try it like that.
I guess the input source could be whatever you want, EXCEPT not an "AC 1" type of source, when doing an AC output impedance analysis.
just need to adjust your expectations, calc the Z of a 220 nanoF capacaitor vs frequency
Zc = 1/(2*pi*f*C)
or change the C value prefix to u for micro or m for milli
Zc = 1/(2*pi*f*C)
or change the C value prefix to u for micro or m for milli
Last edited:
Wombaticus, this is simple and elegant. Just used this technique to determine Zout for a transistor amp. Thanks.
This is how Aksa (Hugh) showed me how to measure it in a real life amp, or you can do it in the simulation for the same thing.
Output Impedance Calculation
set an input at say 200mV, so that output loaded into (this was for a headphone amp, for a speaker amp use 8ohms etc) 100R is exactly 1Vpeak.
Then disconnect the load. (Set load to something high like 10kohm)
The high Z amplitude might be 1.1Vp, for example.
Then take the difference, divide by the loaded value, ie (1.1 - 1).
Then multiply this by the loaded value, of 100R.
In this case, 0.1 x 100 = 10R Zout.
This method is wrong for a number of reasons:
Even in an ideal case, using subtractions of close values is the best recipe to explode the uncertainties budget.
An output impedance can be non-linear or reactive to a certain degree.
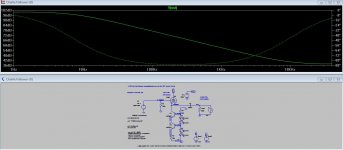
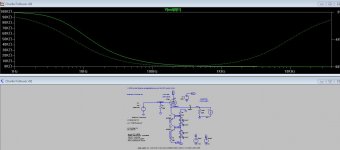
This sim illustrates this case:
The amplifier is symbolized by a voltage source in series with a 0.2 ohm impedance (31.6µH @ 1kHz).
The load impedance is stepped between 100K and 8 ohm
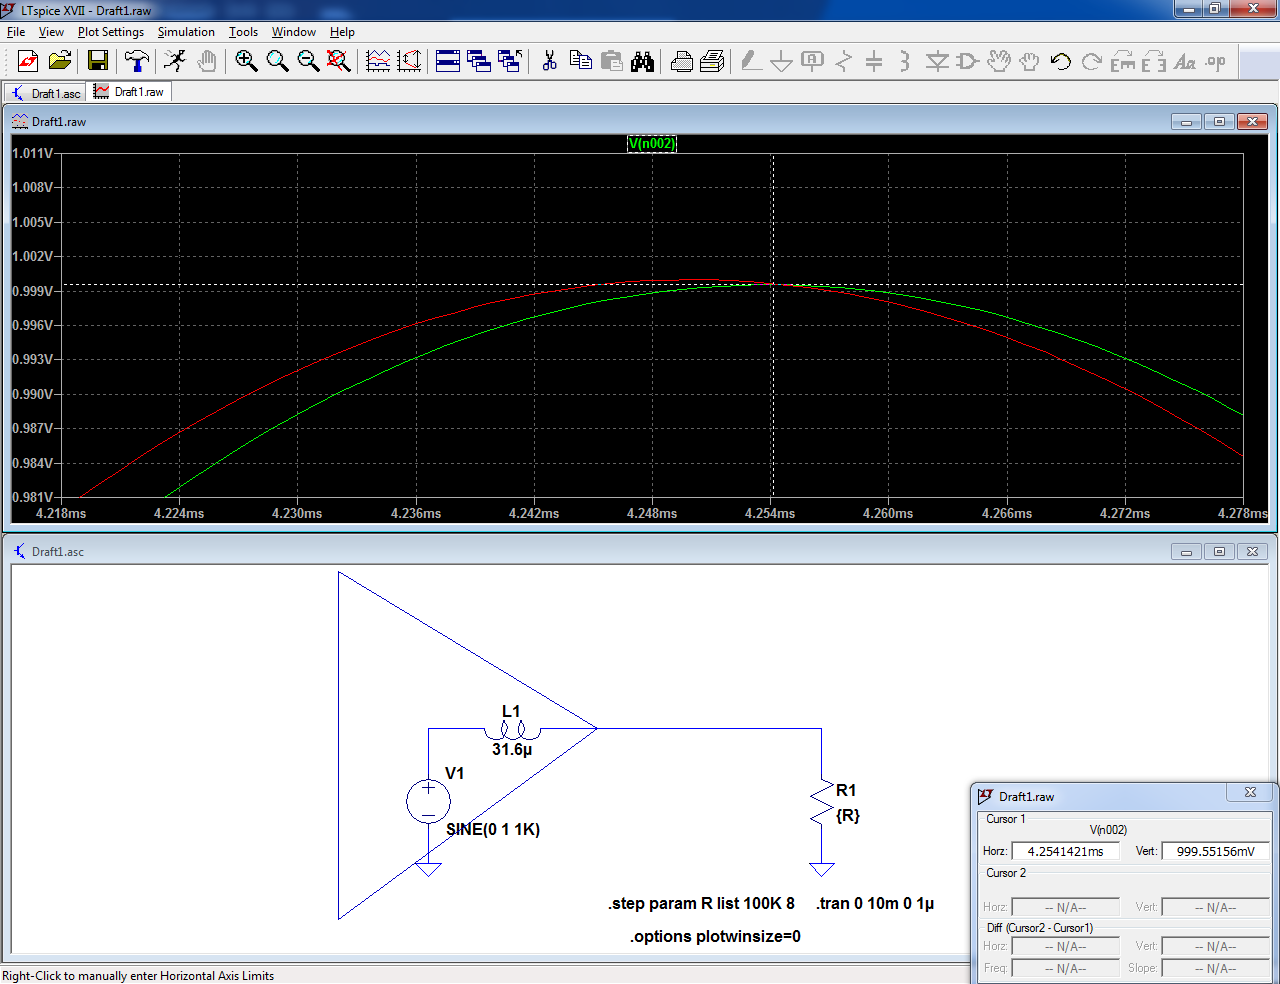
The difference in amplitude is infinitesimal, only 0.05%, because of the vector nature of one impedance.
This is an extreme case, and you could wonder why an amplifier would have a reactive output impedance, but it is in fact normally the case: at high frequencies, an amplifier subjected to GNFB and properly compensated behaves as an inductor, and at low frequencies, an amplifier fitted with an output cap behaves capacitively.
Non-linear effects can also cause important errors.
The correct method duplicates the spice technique: inject a known current into the output using an auxiliary amplifier, and measure the output voltage (with the input grounded, of course)
Even in an ideal case, using subtractions of close values is the best recipe to explode the uncertainties budget.
An output impedance can be non-linear or reactive to a certain degree.
This sim illustrates this case:
The amplifier is symbolized by a voltage source in series with a 0.2 ohm impedance (31.6µH @ 1kHz).
The load impedance is stepped between 100K and 8 ohm
The difference in amplitude is infinitesimal, only 0.05%, because of the vector nature of one impedance.
This is an extreme case, and you could wonder why an amplifier would have a reactive output impedance, but it is in fact normally the case: at high frequencies, an amplifier subjected to GNFB and properly compensated behaves as an inductor, and at low frequencies, an amplifier fitted with an output cap behaves capacitively.
Non-linear effects can also cause important errors.
The correct method duplicates the spice technique: inject a known current into the output using an auxiliary amplifier, and measure the output voltage (with the input grounded, of course)
Attachments
Thanks for the clarification, Elvee. Maybe you can show us how to inject a known current into an amp. Doesn’t sound so simple - nothing is I suppose. The method I show is just an approximation and perhaps works for rather high output impedance amps like SE Class A headphone amps. But is sure is fast to get an estimate of ballpark.
LTSPICE has a built in symbol for an ideal current source. Set it to 1 ampere for AC analysis. After running AC analysis, add trace V(OUTNODE)/I(CSNAME). Notice that LTSPICE correctly displays the units of the vertical axis as Ohms. Yes it is smart enough to figure out that a voltage divided by a current has the units of resistance.
edit- whoops, somebody mentioned this years ago, in post #8. Sorry Tom!
_
edit- whoops, somebody mentioned this years ago, in post #8. Sorry Tom!
_
Last edited:
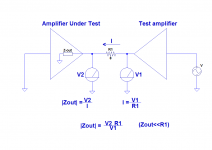
This case is in fact an exception, especially if you test a stereo amplifier.Maybe you can show us how to inject a known current into an amp. Doesn’t sound so simple - nothing is I suppose.
As a picture is worth a thousand words, here is a sketch of a typical test setup.
If you need further clarification, don't hesitate to ask
Note:
The method is best suited to low-Z amplifiers, as are the majority of solid-state designs.
In case the condition Zout<<R1 is not met (less than a 1:10 ratio for example), V1 of the final formula has to be replaced by the voltage across R1 measured differentially.
Do not substitute the difference between V1 and V2, as this would again pose problems of vector and linearity.
Any half-decent, battery operated multimeter can do it (it does not even need to be true rms)
Attachments
Last edited:
- Status
- Not open for further replies.
- Home
- Design & Build
- Software Tools
- Whats the best way to show output impedance with LTSpice?