Hello Everyone!
As I prepare for another blog post on speaker design, I revisited old projects with the ScanSpeak 18W/4531. I had used (successfully) only far-field measurements. I always meant to go back and use near-field measurements and splice them in.
I've finally had the chance to but would like some experienced eyes to help me see the quality of my work. The woofer is in a ported cabinet.
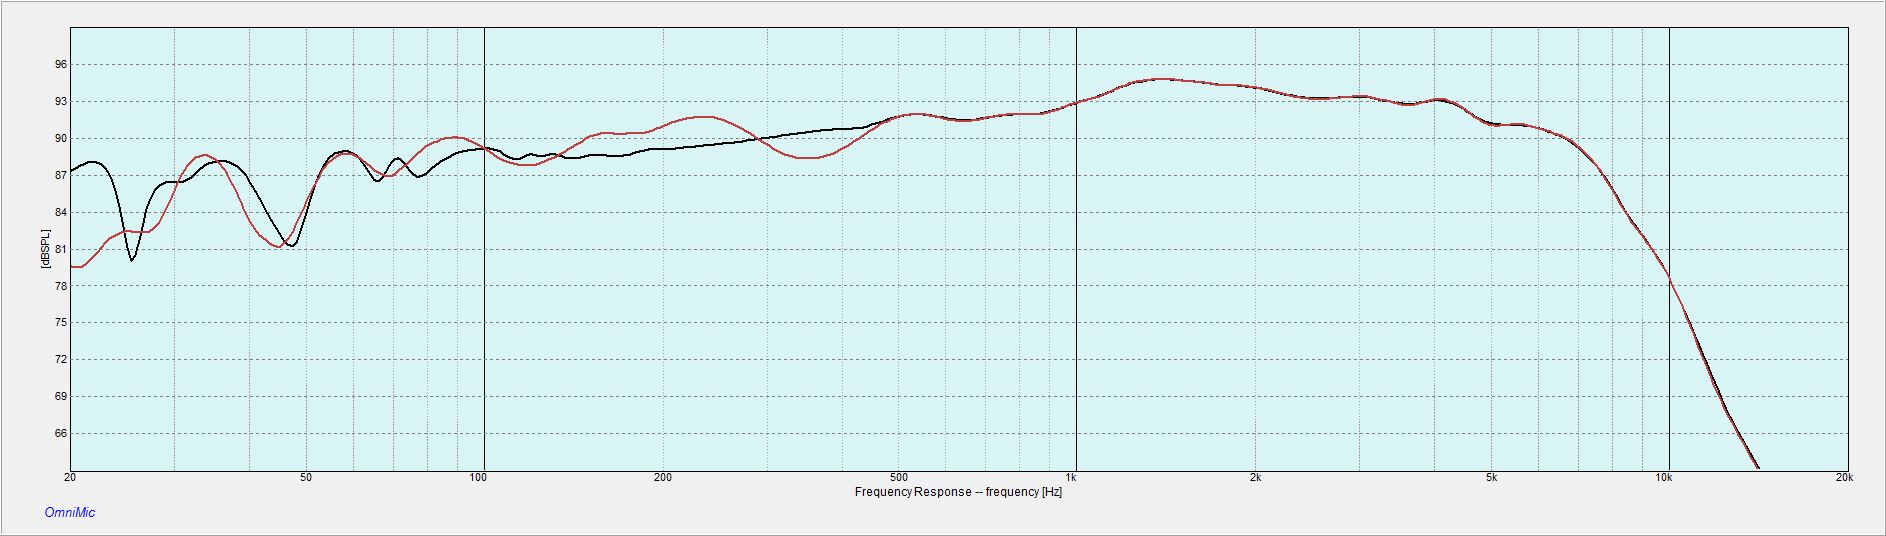
First, an image of the actual far-field vs. the spliced end-result. I used OmniMic at the tweeter axis with gated measurements to around 400 Hz.
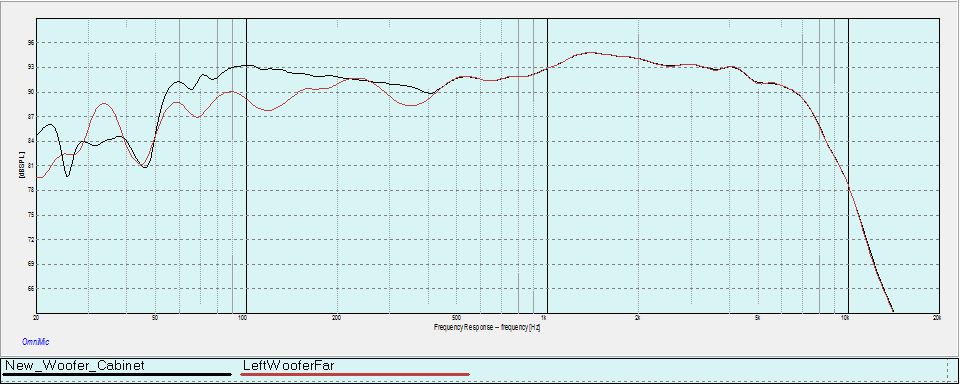
The black line is my completed, spliced result, incorporating near, far and port. The rust/red line is the gated, far-field. My concerns are that perhaps the actual level at 100 Hz is too optimistic in the black version. Perhaps I need to add baffle step contributions?
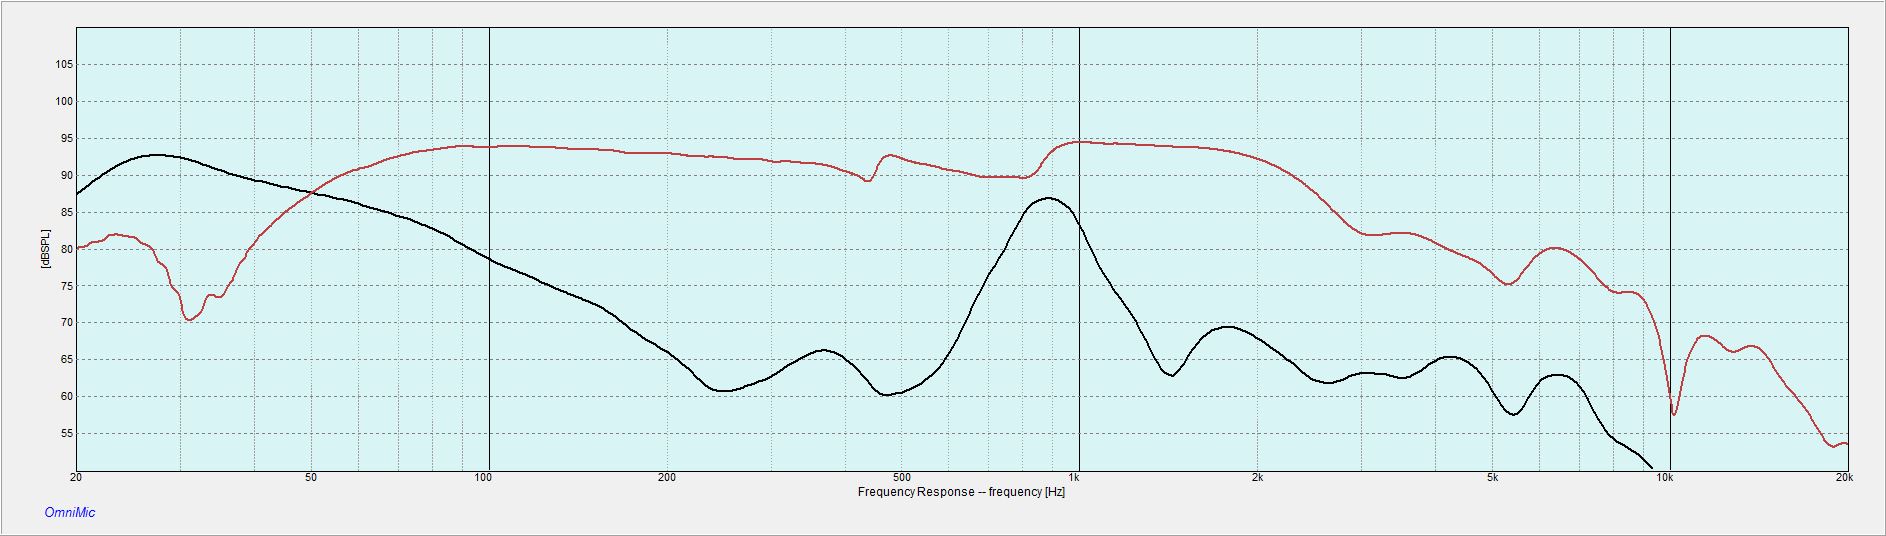
The second chart is the complete near-field (no gating) and complete port. There's an unexpectedly large amount of output at 1 kHz at the port I'm afraid. I took that out before splicing. Please ignore absolute levels, I promise they are wrong.")
Any constructive advice you think I should apply before relying on these measurements I would appreciate. I also worry the port tuning is too low.
Best,
E
As I prepare for another blog post on speaker design, I revisited old projects with the ScanSpeak 18W/4531. I had used (successfully) only far-field measurements. I always meant to go back and use near-field measurements and splice them in.
I've finally had the chance to but would like some experienced eyes to help me see the quality of my work. The woofer is in a ported cabinet.
First, an image of the actual far-field vs. the spliced end-result. I used OmniMic at the tweeter axis with gated measurements to around 400 Hz.
The black line is my completed, spliced result, incorporating near, far and port. The rust/red line is the gated, far-field. My concerns are that perhaps the actual level at 100 Hz is too optimistic in the black version. Perhaps I need to add baffle step contributions?
The second chart is the complete near-field (no gating) and complete port. There's an unexpectedly large amount of output at 1 kHz at the port I'm afraid. I took that out before splicing. Please ignore absolute levels, I promise they are wrong.
Any constructive advice you think I should apply before relying on these measurements I would appreciate. I also worry the port tuning is too low.
Best,
E
Attachments
I used this calculator, which said that based on my baffle width, the limit of close-mic measurements was around 430 Hz.
mh-audio.nl - Nearfield Measurement
Best,
Erik
mh-audio.nl - Nearfield Measurement
Best,
Erik
Thanks Lojzek,
You just reminded me of a question. I have the close-mic FRD. I also have an FRD that expresses the baffle step. This came from "Edge Baffle Designer."
Exactly how can I use OmniMic to add or subtract the baffle step from the close mic measurements? For the life of me the math in this program is the most difficult thing I have ever encountered.
Best,
E
Hi Eric:
I can't answer your question but if you download the spreadsheet that Charlie Laub and Jeff Bagby collaborated on for doing the splicing task with baffle step, you won't need an answer.
FRD Blender and Minimum Phase Extractor
I can't answer your question but if you download the spreadsheet that Charlie Laub and Jeff Bagby collaborated on for doing the splicing task with baffle step, you won't need an answer.
FRD Blender and Minimum Phase Extractor
Hi NC!
I don't have Excel, so I was hoping to do this with the tools I do have.
Best,
Erik
The problem in splicing far and near measurements is that the phase does match - a problem which Frequency Response Blender solves elegantly.
I just checked and LibreOffice will load and run the FRB.xls, but file import fails on Linux.
I'm not done yet... but lesson learned, or idea confirmed:
The results between gated far-field and carefully spliced in far/near and baffle step effects are very very close. As a result, going through the near-field/baffle step calculations for 2-way systems where the crossover point is well within the gating threshold is not very rewarding.
You might as well stick to far-field gated, and do your crossover work from there.
The key to this is that your crossover region is high enough. Once you need a crossover point below the gate frequency the cumbersome, and error-prone, work to get accurate amplitude and phase becomes necessary.
Best,
E
Last edited:
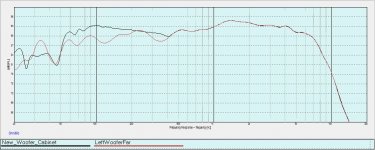
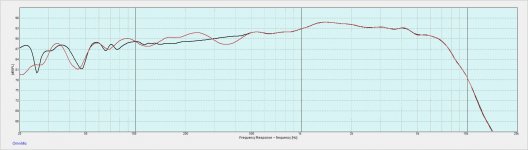
Thanks to everyone's help! I was in fact able to do the work in OmniMic, plus XSim. I'll explain in a bit. I'd like to compare the far-field, gated measurements to the far/near and baffle step compensated results for this woofer:
The very smooth looking black line is of course the latter. I'm also enclosing the port effects. I used XSim to allow me to dynamically change the port level to match the far-field.
The one area where this is not matching well yet is the phase below 100 Hz or something. The far-field and the complicated version are not in good alignment yet.
Best,
E
Attachments
Last edited:
Erik - Something doesn't look right to me. A spliced near field response is usually fairly smooth, like you would see in WinISD. I assume your far-field is gated and the near-field and port measurements are either non-gated or have a gate time > 100 msec. Did you do the splicing in this order?
- Measure nearfield and port at identical levels
- Reduce port measurement by 20 Log (Port Diameter / Effective Cone Diameter).
- Add port and near field responses
- Add simmed BSC to previous step to get full nearfield.
- Adjust the full nearfield level to match the the far-field response. The splicing range should between the far-field gating frequency (lower limit) and an upper limit frequency defined by Fmax = 4311/D where D is the Effective Cone Diameter.
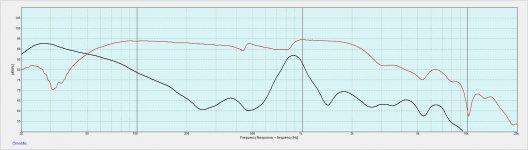
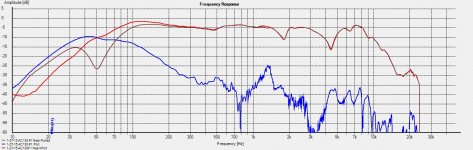
It's also important to get the phase relationships between the near-field and port measurements correct - the port adds (in-phase) to the output after the port maximum and subtracts (out of phase) from the output before the port maximum. In HolmImpulse I use the "time lock" feature to make sure I get the phase relationships correct, not sure how you do that in Omnimic.
The attachment shows what I mean. The brown trace is the near field that shows the dip at 50 Hz, the Fb tuning frequency. The blue trace is the port trace measured at the same level as the near-field trace, but then reduced by 20 Log (Port Diameter / Effective Cone Diameter). The red trace is the sum - you can see how the port adds to the overall output above the port's maximum output, but subtracts from the output at frequencies lower than that. You then add the BSC curve to this sum and then splice to the farfield.
You could always ask about this in the Omnicmic forum over at PE tech-talk.
- Measure nearfield and port at identical levels
- Reduce port measurement by 20 Log (Port Diameter / Effective Cone Diameter).
- Add port and near field responses
- Add simmed BSC to previous step to get full nearfield.
- Adjust the full nearfield level to match the the far-field response. The splicing range should between the far-field gating frequency (lower limit) and an upper limit frequency defined by Fmax = 4311/D where D is the Effective Cone Diameter.
It's also important to get the phase relationships between the near-field and port measurements correct - the port adds (in-phase) to the output after the port maximum and subtracts (out of phase) from the output before the port maximum. In HolmImpulse I use the "time lock" feature to make sure I get the phase relationships correct, not sure how you do that in Omnimic.
The attachment shows what I mean. The brown trace is the near field that shows the dip at 50 Hz, the Fb tuning frequency. The blue trace is the port trace measured at the same level as the near-field trace, but then reduced by 20 Log (Port Diameter / Effective Cone Diameter). The red trace is the sum - you can see how the port adds to the overall output above the port's maximum output, but subtracts from the output at frequencies lower than that. You then add the BSC curve to this sum and then splice to the farfield.
You could always ask about this in the Omnicmic forum over at PE tech-talk.
Attachments
Last edited:
Thanks. The nearfield is very clean. See the second chart which shows it and the port alone. I think what's really happening is that my port tuning frequency was too low, so it's not adding up well.
I totally cheated with adding the port. I used XSim to let me adjust the port level until the spliced result matched the farfield.
I used interferometry to try different distances between the woofer and port.
I totally cheated with adding the port.
I used XSim to let me adjust the port level until the spliced result matched the farfield. I used interferometry to try different distances between the woofer and port.
You know, I wonder if I have stumbled upon something here. The smothly additive FR charts like ernperkins is kind enough to upload is, of course, textbook. Reviews from Stereophile and others do the same. However, I've NEVER actually seen it happen. On the other hand, the W shaped curve (below near field roll-off) I derived by hacking together the port and near-field IS what I measure, often.
Ignoring convention and practice, how do I empirically prove my method wrong?
Best,
E
Ignoring convention and practice, how do I empirically prove my method wrong?
Best,
E
Last edited:
Look up the Arta manual - it will give you good insight on how to do it properly as you need to adjust for the difference in distance and port gain. Also, the response should be very smooth, almost cheat like Yours didn` look this way. The spike you see at the port is a port resonance, looks liek you use a circular port. Slotted ones tend to exhibit two narrow spikes.
Is the driver mounted on some baffle? I have used the same unit and it didn`t exhibit the drop at 450-500Hz you have? Also, I just noticed - you have a null at 4.6Khz, the nearfield of the 18W/4531 should not have this. The 1.6Khz one is a surround issue and has been captured, although it should be only 2.5db down there. Your mic/sound card are not calibrated for SPL, whoever calibrated your mic should have provided characteristic sensitivity for it. The NF curve should not be upwards sloping for this driver, yours appears to be. Considering the dip at 4.6Khz, the somewhat raged response and the upward sloping curve, are you sure you measure near enough? You need to be very close to the driver`s dust cap, 5mm or so and measure at very low ampliture or your mic will clip (one of the differences between a cheap and expensive mic is SPL they can handle which matters a lot at NF measurements).
Yours didn` look this way. The spike you see at the port is a port resonance, looks liek you use a circular port. Slotted ones tend to exhibit two narrow spikes.Is the driver mounted on some baffle? I have used the same unit and it didn`t exhibit the drop at 450-500Hz you have? Also, I just noticed - you have a null at 4.6Khz, the nearfield of the 18W/4531 should not have this. The 1.6Khz one is a surround issue and has been captured, although it should be only 2.5db down there. Your mic/sound card are not calibrated for SPL, whoever calibrated your mic should have provided characteristic sensitivity for it. The NF curve should not be upwards sloping for this driver, yours appears to be. Considering the dip at 4.6Khz, the somewhat raged response and the upward sloping curve, are you sure you measure near enough? You need to be very close to the driver`s dust cap, 5mm or so and measure at very low ampliture or your mic will clip (one of the differences between a cheap and expensive mic is SPL they can handle which matters a lot at NF measurements).
Last edited:
Erik - Something doesn't look right to me. A spliced near field response is usually fairly smooth, like you would see in WinISD. I assume your far-field is gated and the near-field and port measurements are either non-gated or have a gate time > 100 msec. Did you do the splicing in this order?
- Measure nearfield and port at identical levels
- Reduce port measurement by 20 Log (Port Diameter / Effective Cone Diameter).
- Add port and near field responses
- Add simmed BSC to previous step to get full nearfield.
- Adjust the full nearfield level to match the the far-field response. The splicing range should between the far-field gating frequency (lower limit) and an upper limit frequency defined by Fmax = 4311/D where D is the Effective Cone Diameter.
It's also important to get the phase relationships between the near-field and port measurements correct - the port adds (in-phase) to the output after the port maximum and subtracts (out of phase) from the output before the port maximum. In HolmImpulse I use the "time lock" feature to make sure I get the phase relationships correct, not sure how you do that in Omnimic.
The attachment shows what I mean. The brown trace is the near field that shows the dip at 50 Hz, the Fb tuning frequency. The blue trace is the port trace measured at the same level as the near-field trace, but then reduced by 20 Log (Port Diameter / Effective Cone Diameter). The red trace is the sum - you can see how the port adds to the overall output above the port's maximum output, but subtracts from the output at frequencies lower than that. You then add the BSC curve to this sum and then splice to the farfield.
You could always ask about this in the Omnicmic forum over at PE tech-talk.
Adding port to the driver nearfield: the LspCad instructions are simpler, the port trace should be lowered so that its' level matches the driver NF below the Fb. In this case the blue trace should be lowered by additional 3dB (aprx) so that it overlaps the brown at 30 Hz.
- Status
- This old topic is closed. If you want to reopen this topic, contact a moderator using the "Report Post" button.
- Home
- Loudspeakers
- Multi-Way
- Art of FR Splicing: SS 18W/4531