
The ARTA measurements are very close to the REW measurements.
What is the real thing, then?
Not sure if I understand your question, it's the same hardware running with two different software, and both are "very real".
The THD results between the 2 software are practically the same at the same signal level. The THD+N are slightly different, but with different settings among the 2 software (FFT length, noise bandwidth ... etc) some differences are expected anyway. Even within the same software, changing a parameter will impact the measurements.
The THD results between the 2 software are practically the same at the same signal level. The THD+N are slightly different, but with different settings among the 2 software (FFT length, noise bandwidth ... etc) some differences are expected anyway. Even within the same software, changing a parameter will impact the measurements.
Not sure if I understand your question, it's the same hardware running with two different software, and both are "very real".
The two measurements are practically the same, but do we know the absolute value? If we do not know that, how do we know how close we are to that?
You meant, what is the limit of RTX Ghianni?
From datasheet I see, THD<-115/-116dB for BW 20-20KHz/48KHz/0dBV/1KHz, this means something like 0.00016-0.00017% THD
For THD+N something like -105dB or 0.00056% at the -1dBFS.
For lower levels the THD will be lower.
From datasheet I see, THD<-115/-116dB for BW 20-20KHz/48KHz/0dBV/1KHz, this means something like 0.00016-0.00017% THD
For THD+N something like -105dB or 0.00056% at the -1dBFS.
For lower levels the THD will be lower.
Last edited:
The two measurements are practically the same, but do we know the absolute value? If we do not know that, how do we know how close we are to that?
The RTX is calibrated at the factory and if you run the ARTA calibration against that you should know to a high degree of certainty - to within the stated bounds of the device performance given in the manual.
The two measurements are practically the same, but do we know the absolute value? If we do not know that, how do we know how close we are to that?
The absolute value of what exactly? It really depends on what the software does, and how it does it. If you really want to know, it's best to go with open source software, where you can take a look at the code and understand all the details.
The two measurements are practically the same, but do we know the absolute value? If we do not know that, how do we know how close we are to that?
The hardware performance are specified in the User Manual:
THD @ 0 dBV
THD 48 kHz sample rate fundamental 20 Hz to 20 kHz typical -124 dB @ 1 kHz < -116 dB
THD 192 kHz sample rate fundamental 20 Hz to 20 kHz typical -121 dB @ 1 kHz < -115 dB
THD @ 10 dBV
THD 48 kHz sample rate fundamental 20 Hz to 10 kHz typical -119 dB @ 1 kHz < -115 dB
THD 192 kHz sample rate fundamental 20 Hz to 40 kHz typical -119 dB @ 1 kHz < -115 dB
THD+N, 1 kHz @ 0 dBFS 20 kHz BW
THD+N 48 kHz sample rate typical -107dB
THD+N 192 kHz sample rate typical -107dB
However, you'll need to choose the input/output range properly to get to those values. e.g. With RTX set to 0dBV/0dBV input/output range, you're not going to get -116dB THD @0dBV result, but change the input range to 20dBV and you can easily get -116dB (even the typical -124dB) @0dBV, cause we're measuring at -20dBFS then.
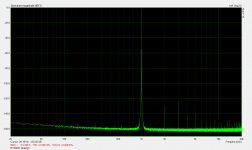
The ARTA measurements are very close to the REW measurements.
Hmmm... Maybe I am just confused, but I wonder how the noise floor can be at -160 dB, if the RTX specs are more like -120 dBV? Can someone please point my brain in the right direction?
Hmmm... Maybe I am just confused, but I wonder how the noise floor can be at -160 dB, if the RTX specs are more like -120 dBV? Can someone please point my brain in the right direction?
dBV vs dBFS ?
The input noise level of around -120 dBV, depending on the bandwitdh included, is an RMS value.
The ~ -160 dB is the level of the individual FFT bins. The larger the FFT window, the lower the values will be. But if you add them up to an RMS value, you should end up at around -120 dBV RMS.
The ~ -160 dB is the level of the individual FFT bins. The larger the FFT window, the lower the values will be. But if you add them up to an RMS value, you should end up at around -120 dBV RMS.
Hmmm... Maybe I am just confused, but I wonder how the noise floor can be at -160 dB, if the RTX specs are more like -120 dBV? Can someone please point my brain in the right direction?
-120dBV is RMS, 20k BW. The 'grass' on FFT has a much smaller effective BW
as it is like a sweep of narrow band filter.
Clear as mud?
Maybe a little maths to stir things up, what the spec says:
Residual input noise (20 kHz BW) unweighted: ≤0.75 μV (-122 dBV) (5nV/rtHz)
Noise spectral density = 5nV/rtHz = -166dBV/rtHz
Noise (20k Hz BW) = 5nV/rtHz * sqrt(20k Hz) = 0.71 uV ~ 0.75 μV (-122 dBV)
Everything looks good")
In ARTA, choose PSD (Power Spectral Density) under Spectrum Scaling, then noise can be displayed correctly in dBV/rtHz, independent of the FFT length. Calibration will be required though, as the vertical scale is no longer relative.
Residual input noise (20 kHz BW) unweighted: ≤0.75 μV (-122 dBV) (5nV/rtHz)
Noise spectral density = 5nV/rtHz = -166dBV/rtHz
Noise (20k Hz BW) = 5nV/rtHz * sqrt(20k Hz) = 0.71 uV ~ 0.75 μV (-122 dBV)
Everything looks good
In ARTA, choose PSD (Power Spectral Density) under Spectrum Scaling, then noise can be displayed correctly in dBV/rtHz, independent of the FFT length. Calibration will be required though, as the vertical scale is no longer relative.
Last edited:
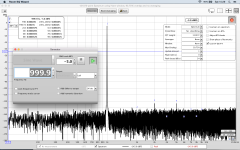
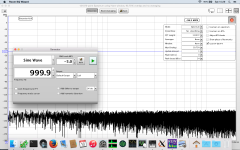
To get me started with my RTX 6001 I thought I'd do a loopback test with REW so I could compare to the results shown here before. I can't quite reproduce the noise floor shown in posts 1371 (or 1381 / ARTA), where the noise floor is about -160 dBFS. I am getting more like -135 dBFS.
I am not sure what I am doing wrong. For analysis results in the attachments, the RTX was set to the 1V ranges for both output and input. The only difference to post 1371 I can see is that I couldn't figure out how to reduce the bandwidth of the analysis to 20Hz...20kHz.
Any ideas?
I am not sure what I am doing wrong. For analysis results in the attachments, the RTX was set to the 1V ranges for both output and input. The only difference to post 1371 I can see is that I couldn't figure out how to reduce the bandwidth of the analysis to 20Hz...20kHz.
Any ideas?
Attachments
Take a look at post #1369,1370, kannan_s had the same noise floor issue with REW and solved it with some settings.
That was an ASIO-driver/Windows thing. I used a Mac, where ASIO is not relevant.
- Home
- Design & Build
- Equipment & Tools
- DIY Audio Analyzer with AK5397/AK5394A and AK4490