Just remember the cardinal rule of simulation: garbage in gives garbage out. Please read this to make sure you're giving XSim the proper inputs:
Paul Carmody's DIY Speaker Pages - Simulated Measurements pt1
Paul Carmody's DIY Speaker Pages - Simulated Measurements pt1
Changing phase tails beyond measurement window
What do you look for to see if changing the phase tails improves accuracy? I've played with this but have no conclusion about correct or incorrect. Do you try to match the measured slope?
Pawel –
3. Files copied from response graphs don’t contain important phase data. I used XSim to create phase data for all four files. If you’re not familiar with this capability, here’s how to create phase data:
- Right click on a driver and select the Tune option. Then select the “derived” option in the “FRD phase source” box. In the next window you can define the frequency and slope of the lower and higher tails. Tails are fixed slope extensions to the data that increase the accuracy of the generated phase data.
- To create phase data for the impedance file select the “derived” option in the “ZMA phase source” box.
- To see the FR effects of the phase data: Open one of simulations and perform the above steps for both drivers, but select the “as measured” option instead. Notice the change in the system response without phase data. Then repeat the above steps again and re-select the “derived”options. You’ll then see how I tailed the .frd files.
What do you look for to see if changing the phase tails improves accuracy? I've played with this but have no conclusion about correct or incorrect. Do you try to match the measured slope?
Last edited:
The operation that creates phase from a frequency response is called the Hilbert Bode transform. It's most accurate when it has data from zero to infinity. That's not possible so adding tails is a way of extending the frequency response to make the transform as accurate as possible. So the tails are an estimation of the speaker's response beyond the measurement. Yes, you try to match the low and high end slopes of the frequency response. This is usually easy with the low end responses, but harder with the high end responses since they may include break up responses (woofers) or simply end before an roll-off slope occurs (tweeters). I typically use 12 dB/oct on the high end.
Perhaps Bill W. or someone else will respond with a more informative response.
Perhaps Bill W. or someone else will respond with a more informative response.
Last edited:
Thanks ernperkins. Your response seems logical to me. I've adjusted the tails up and down, trying to match the measured slope or greater. Woofers with high breakup seem to fall faster, after the break up, than smoother woofers.
I wonder if adjusting the lower tail on a woofer is useful for adding the room rise in low end response. In my case, the room starts to rise at 9dB/Oct from 27Hz down. Would subtracting that rise from the woofer fall in the bottom be useful? For example - if a closed box woofer falls at 12dB/Oct, would a -3 tail on the bottom, at the right frequency, be useful?
I wonder if adjusting the lower tail on a woofer is useful for adding the room rise in low end response. In my case, the room starts to rise at 9dB/Oct from 27Hz down. Would subtracting that rise from the woofer fall in the bottom be useful? For example - if a closed box woofer falls at 12dB/Oct, would a -3 tail on the bottom, at the right frequency, be useful?
The breakup region is unique, and often not used for good reason. Don't put too much stock in what you see there in an axial response measurement as it isn't representative (it is more acceptable to use an axial measurement in the 'normal' range of the driver).
Attachments
Tail slope affects phase tracking
Perhaps I'm asking too much of the modeling part of the program and should accept being in the ball park. Altering the phase tail does alter the phase in the 'normal' range, while doing virtually nothing to the frequency response in the normal range, or anywhere. Phase tracking in the crossover region and beyond, on both low and high sides, is affected by changing the slope of the tails.
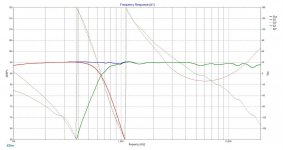
I'll add a couple of pics for examples, just changing the slope of the upper tails on the woofer:
15" woofer. 9db upper tail. 2.5Khz -
https://www.diyaudio.com/forums/attachment.php?attachmentid=999037&stc=1&d=1637418337
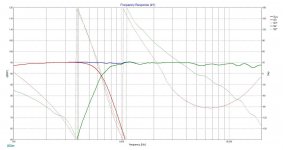
15" woofer. 15db upper tail. 2.5Khz -
https://www.diyaudio.com/forums/attachment.php?attachmentid=999039&stc=1&d=1637418338
Please, what are you describing with your target pic?
Perhaps I'm asking too much of the modeling part of the program and should accept being in the ball park. Altering the phase tail does alter the phase in the 'normal' range, while doing virtually nothing to the frequency response in the normal range, or anywhere. Phase tracking in the crossover region and beyond, on both low and high sides, is affected by changing the slope of the tails.
I'll add a couple of pics for examples, just changing the slope of the upper tails on the woofer:
15" woofer. 9db upper tail. 2.5Khz -
https://www.diyaudio.com/forums/attachment.php?attachmentid=999037&stc=1&d=1637418337
15" woofer. 15db upper tail. 2.5Khz -
https://www.diyaudio.com/forums/attachment.php?attachmentid=999039&stc=1&d=1637418338
Please, what are you describing with your target pic?
Attachments
Last edited:
Yes and no. If there is a large peak which is only on-axis, and for some reason you are unable to get far enough away from it by frequency, then maybe toeing in the speakers would be preferred so that you are not on-axis. This way, what you listen to is closer to representative of the overall sound, and you have avoided altering that with a large notch filter that doesn't follow the overall trend.Perhaps I'm asking too much of the modeling part of the program and should accept being in the ball park.
This is one way to handle a unique situation. A spatial situation that wants a spatial solution.
Tail slope affects phase tracking
I was specifically addressing tail slope adjustment that affects phase tracking in band. It's a modeled function that has reasonable limits, and uses some assumptions. ernperkins wrote how he uses it. I was wondering if there are some useful 'rules of thumb' depending on the driver being used, and how other people use this function.
If I have a speaker where the on axis peak is so large I have to use toe in, I'll aim it at the wall and use it like a bose 901. That's a spatial solution")
Please, what are you describing with your target pic?
I was specifically addressing tail slope adjustment that affects phase tracking in band. It's a modeled function that has reasonable limits, and uses some assumptions. ernperkins wrote how he uses it. I was wondering if there are some useful 'rules of thumb' depending on the driver being used, and how other people use this function.
If I have a speaker where the on axis peak is so large I have to use toe in, I'll aim it at the wall and use it like a bose 901. That's a spatial solution
Please, what are you describing with your target pic?
Last edited:
The relative insignificance of an on-axis measurement as seen by sectioning a sample radiation pattern. (This was drawn for a waveguide but the point is the same...)Please, what are you describing with your target pic?
What you see on axis through breakup can be very different to the average sound. You said...
Rather than the ball park, think about using the average. Ordinarily that means if you take measurements at different angles, you can get your average from them.. however all I'm saying is be wary of getting fixated on the more extreme looking but less significant features of the on-axis response because they are far from average.and should accept being in the ball park.
Also, rather than pointing at the wall and get the spike back as a reflection, try to send it up the room so it comes back averaged.
I don't use a 15" woofer in the break up region. My graphs show a LR48dB/oct crossover at 650Hz. I'm already -48db at break up. The graphs do show a significant difference in phase tracking, in the crossover area, 650Hz, when the phase tail is changed from -9db to -15db, above 2.5Khz, in Xsim3D. A change that is a model. A change that is made at -95db, and two octaves, above the crossover. It still affects the phase a octave below the crossover.
My goal is getting the phase tracking through the crossover region right. I want to use the model effectively.
I have less concern for frequency/power response off axis. My off axis listening is casual. On axis response is important in a 2 ch or a 7 ch setup like I'm using. On axis is the only place the image is developed.
I say 'be wary of getting fixated on the ... less significant features of the OFF-axis response because OFF-axis listening is more 'casual'. OFF-axis is ambiance - an expensive table radio.
Cheers
Last edited:
Hi. I started with xsim today. This is my first time with crossover simuation software.
I have experience with DSP, measurements with ARTA and also passive crossover design with the time consuming «test-messure-again again» method.
Is this the right way to work?
I measured the impedance with the drivers mounted in the cabinet with Dats V3
I traced the FR curves from Seas with this software
http://labs.fprawn.com/index.php/fpgraphtracer/
http://www.seas.no/index.php?option...=99:h1499-06-27tbcdgb-dxt&catid=45&Itemid=462
http://www.seas.no/index.php?option...le&id=95:h1471-08-ca22rny&catid=44&Itemid=461
A person could find themselves doing this with any crossover method. Inherently it's fine, but it may be a sign there's a problem.. so the question is why, or what do you find when you do? Also what's different about how do you do your DSP crossovers?the time consuming «test-messure-again again» method.
Please understand, I do my DSP crossovers exactly the same as passive (except for the filters, of course), so I'm trying to understand where you're coming from as well
OK, you've traced manufacturer data but I would have measured. What is your reasoning there? The manufacturer data doesn't include your cabinet.
OK, you've traced manufacturer data but I would have measured. What is your reasoning there? The manufacturer data doesn't include your cabinet.
Until you measure the driver raw response in your cabinet, the simulation won’t be accurate. Mostly it’s the acoustic offset which needs to be accurate to the mm. This can only accurately done by using acoustic interferometry. Measure in actual cabinet, woofer by itself, tweeter by itself, both in parallel and never touch the mic or the speaker. The use Xsim acoustic offset delay to predict the combined measurement from the raw measurement down to the last wiggle in no smoothing mode. Then you can accurately predict the XO’s effect.
Not so. Why wouldn't you simply measure each driver while leaving the mic in one position and including the natural timing?This can only accurately done by using acoustic interferometry.
This is for people like me who still don’t use a two channel audio interface for timing info. MiniDSP USB UMIK-1 has no timing info. Mic is in one position - cannot be touched. I haven’t bought a calibrated XLR mic yet. So I guess I should have said if using only 1 mic and no timing info, can only be done by interferometry. I also think that the interferometry provides very conclusive evidence that simulation is working correctly before any filters are added.
- Home
- Design & Build
- Software Tools
- XSim free crossover designer