Every system, loudspeakers or otherwise, that does not have a perfect impulse (which translates to flat amplitude and linear or zero phase) has stored energy or linear distortion. Put simply, that means it takes time for the system to response to the input. That is the point of the WTF in the first place, to visualize the time distortion. Being that it takes time to response and being that the wavelet has a continuous time variation, the system can not reach its steady state amplitude because, due to the time lag, the system will always have an output amplitude some what different than it would if given the same amplitude input in SS. Thus, when the wavelet reaches its peak level the system will not be at that peak. But then the wavelet amplitude begins to decay and, as a result the system is no longer being forced toward the max level and it will also begin to decay. Only if the system has perfect response will it exactly follow the input. So, when the system is responding to a wavelet input it can never reach the true SS values of amplitude. Depending on the transient response of the system, it may come close at some frequencies and not so close at others. But the wavelet, being time varying and hitting peak amplitude only for an instant, will never drive the system to SS amplitude, unless the system is perfect. There can never be a constant time slice of a wavelet transformation which has the same amplitude spectrum as the steady state frequency response unless the system is perfect. The dips and peaks seen in the wavelet plots may be indicative of dips and peaks in the SS FR, but they are not the same amplitude.
Thanks for that – think it puts it very well – though its nothing different to what I said - but it saves me a lot of ping pong gaming with JohnPM (seems I have to work harder on my „speak“
") )
) But IR>FR>IR looses nothing.
If you state, that even with CMP systems you can go back an forth between time domain and frequency domain – I simply have to – and do - belive you (its you who is the math magician here, after all).
What I still keep up though, is that „FR concept“ is void with CMP systems – simply as it does not show us discontinuity in time line – or possibly better said – a FR plot „may“ show it, but in a way no one has ever realized its implications as it seems.
The point thats missing in your above post, is to make clear that there is a discontinuity in time line, with distinguishes CMP from non-CMP systems.
In comparison a non CMP system (red trace) showing a sine burst at a resonating freqeuncy:

Its always the same old boring story with non-CMP systems – log envelope + time constant depending on Q – thus FR (= steady state spectral distribution) at time slot „eternity“ :
Quite a difference, both in a time amplitude or time frequency plot between non-CMP systems and CMP systems I'd say.
A correctly designed dipole or OB system takes care to assure that and so called CMP or double impulse behavior is eliminated.
The low pass filtering of OB is to keep directivity controlled but has nothing to do with CMP issue (well at first hand).
Didn't say it would.
One can't deny the significance of CMP above the "peak"
However I'm not so sure it is as big problem below as you show in the paper.
.
Would not say that CMP is a „big problem“ at all – I mean, how long have people been listening to Quad now and enyojed it a looooot ???
Sure, there are ways to „dimdinish“ CMP – two - as I see it right now.
One is to knock it down with filters in the sense that it gets masked to the point where in fact its hard to measure CMP distortion at least it gets hardeer and harder to identify in IR plots
(this is what John has pointed out)
The other way is to optimize diffraction alignment. We have to remember that all (most of) those CMP time delay issues ground on reflections due to diffraction issues.
As John is favouring the first attemt, it might be interesting to look at how / to what extent LP filtering „masks“ CMP
LP filters are arbitrary chosen for simplicity – and to show tendency only.
In continuation to my already lengthly paper http://www.kinotechnik.edis.at/page...ine/CMP_Behaviour-Bridging_Points_of_View.pdf
here are to times four plots that compare CMP time behavoior with and without LP filter First lets look at frequency domain:

Now lets lok at time domain - all traces overlayed

Now lets lok at time domain – comparing CMP / non-CMP without LP filtering (as alread shown in my paper)

Now lets lok at time domain – comparing CMP / non-CMP with LP filtering

And as I already hear you shouting „the LP filter is set waaaaay to high“ - here the same strip with LP filter shifted down by an octave:
First lets look at frequency domain:

Now lets lok at time domain - all traces overlayed

Now lets lok at time domain – comparing CMP / non-CMP without LP filtering (as alread shown in my paper)

Now lets lok at time domain – comparing CMP / non-CMP with LP filtering

From above we clearly see that with LP fitering its not possible to „really“ correct for CMP discontinuity (1ms delay time).
As outlined in my paper there are ways to „really“ correct CMP distortion upstreams, but unfortunately there is no way this ever will work in reality.
Leaves us with „treating“ CMP at its roots : by diffraction alignment
(if we ever should be interested in „treating“ CMP at all)
The choice is ours !
Michael
Last edited:
Really, I still don't see why we need a funny name like CMP. It just creates some illusion that something is happening that has not been identified otherwise.
So after all this talk, the problem is still "how can the source if cause be identified". I don't see the CMP thing addressing the issue. As a matter of fact, I still don't understand what additional issue it's addressing.
So after all this talk, the problem is still "how can the source if cause be identified". I don't see the CMP thing addressing the issue. As a matter of fact, I still don't understand what additional issue it's addressing.
What is your definition for "absolute phase reference" ?
Wavelets are by no means the optimal TFR, the wavelet transform distorts amplitudes (HF is attenuated) and does not maintain absolute phase reference.
Hi Michael,
Maybe can repeat the simulation but first set the low pass corner freq below 20Hz (the green curve below) to equalise the dipole in the pass band.
- Elias
Maybe can repeat the simulation but first set the low pass corner freq below 20Hz (the green curve below) to equalise the dipole in the pass band.
- Elias
Referenced to an absolute time, as an example the phase values in a Fourier Transform are referenced to t=0What is your definition for "absolute phase reference" ?
If you state, that even with CMP systems you can go back an forth between time domain and frequency domain – I simply have to – and do - belive you (its you who is the math magician here, after all).
What I still keep up though, is that „FR concept“ is void with CMP systems – simply as it does not show us discontinuity in time line – or possibly better said – a FR plot „may“ show it, but in a way no one has ever realized its implications as it seems.
Show is the key word here. FR is not a void concept with any system. The definition of SS remains accurate and the SS FR does contain all the time information of any system (assuming the system is linear, time invariant). It may not show it in an easily recognized manner but that is not unique to your so called CMP systems. All minimum phase systems have time distortion and the information about that distortion is always in the SS FR. The impulse response and/or frequency response are obtainable by direct measurement. We typically choose some form of IR measurement because it is quick, easy, and with the FFT we get the complex FR without much effort.
The WFT is not a measurable quantity, or at least if we attempted to measure it would be very time consuming. We measure the IR or SS FR and then construct the WFT from it. Thus, I consider the WFT a display tool. It is based on the IR, or as in the referenced paper, the FR is used to generate the WFT. So obviously all the time information one gleams from the WFT is a consequence of that information being contained in the SS FR. The FR is not a void concept. If it were it would follow that the WFT is just garbage.
Although the delay in a double impulse may not be obvious when looking at the FR alone, the information is there. It is evident in the phase response. You have focused only on the amplitude. And the group delay shows it as well.
The caveat here is, as you stated, what shows what in a simple manor. That is the purpose of all the different ways we post process the IR or FR; to show things that are not obvious when looking at the IR or FR directly. It is a matter of how information is presented, not a matter of presenting new information. It is all there in the IR and FR and neither is a void concept. Either one, separately, defines the system.
But one thing that should be recognized is that the WFT doesn't show the transient response of the frequency response of the system. There is always a smearing of the time/frequency data. Never the less, the WFT can be considered a useful tool in examining the system. But it doesn't generate new information. It just displays the same data in a new light. Just like what you see in a room changes when you light the room with an incandescent light bulb or a UV light. Nothing is changes, you can just see things differently.
WFT is a fine tool. I don't want to continue to discuss it. It is the CMP concept that we see differently.
I am not missing anything here. I would repeat that the facts you continue to reject are that all the info about a system is in the SS FR and that if the system is MP then MP EQ will correct the time response.
I am not going to response all your plots below. They all are just fine and show exactly what they are intended to show. What they do not show is what I previously went through in detail. How to EQ the CMP system so that the CMP behavior is eliminated. The point remains that if the system is MP, then the impulse response of the system is defined by the SS FR of the system.
Rather than repeat that example, I'll approach it from the mathematical side. It becomes pretty black and white at that point.
If you accept the fact that we can go back and fourth between the time and frequency domain using the FFT/IFFT then it should be apparent that any two systems which have the same complex frequency response must also have the same impulse response. And I hope you accept that fact that if F(s) and G(s) are minimum phase transfer functions expressed int he frequency domain, then H(s) = G(s) x F(s) is also minimum phase. The next step is the fact that a minimum phase transfer function has an inverse which is also minimum phase, thus 1/F(s) is also MP. It follows that if G(s) = 1/F(s) then H(s) = 1.0 and as you should know, the IFFT(H(s)), for H(s) = 1.0 is a perfect impulse. Now I am not interested in continuing on with the discussion of how to emulate 1/F(s) or even if I can be emulated. The point is that the mathematics of the problem tell us that it is possible. Thus what ever CMP system you have, one pulse, two pulses, 10 pulses, if that system is MP and has response CPM(s), then 1/CMP(s) is MP and H(s) = CMP(s) x 1/CMP(s) = 1 and has perfect impulse response. 1/CMP(s) is the equalization function. At that point we can construct a band pass response by applying HP and LP fitters such than BP(s) = LP(s) x HP(s) x H(s), and if LP(s) and HP(s) are MP, then BP(s) is also MP and regardless of what CMP(s) was in the first place, the resulting BP(s) has impulse response bp(t) = IFFT(BP(s)) which is the impulse response of any minimum phase bandpass with same amplitude and BP(s).
Now, how we actually approximate 1/CMP(s) is another, separate issue. Obviously, or it should be obvious, if the LP filter has a 4th order slope and corner frequency, fc, then 2 octaves above fc the response is attenuated by 48 dB and increasing. Thus, since the response is so attenuated there really isn't any need to extend the EQ past that point. This isn't any different than what we do with a conventional speaker which uses a driver with break up resonance at 5k Hz. If we LP filter the driver at 1k Hz we don't worry about flattening the the resonance peak because it will be attenuated sufficiently by the LP filter.
In any event, that is that and you can continue to create plots and results which show what they show because the response you generate retains multiple pulse behavior. If you goal is to generate response that have that behavior I would certainly expect to see it. Your example are intended to contradict, so I would expect them to. Of course, I would not listen, nor to I believe anyone would intensionally build a speaker with the response you use as examples. How many times do we have to repeat that if the response is MP and have multiple impulses and it is MP equalized to a target that does not have multiple impulses then the Eq'ed system won't have multiple impulses? I keep saying A X B = C and you keep showing A X D doesn't = C. Is any one surprised when D doesn't equal B? You keep showing CMP systems and saying SEE, I TOLD YOU SO! And I keep on informing you that we (or at least me and a number of other dipole speaker designers I know of) don't build CMP systems. We may start with them and then correct the transform the CMP system into SMP system, (Simple Minimum Phase system). We do that because if it isn't done the speaker sound like S*&#.
New ideas !
Hello everyone,
At the moment I'm experimenting with a new type of wavelet. It's based on human psychoacoustic model. It models the critical bandwidth formed by the basilar membrane in cochlea. Human process broad band sound dividing them into subbands. The idea is to generate wavelets that match the critical bands. I'm expecting this kind of a wavelet to better describe and analyse what is being heard of the impulse response than previous methods (freq response, CSD etc.)
Basilar membrane - Wikipedia, the free encyclopedia
From Zwicker / Fastl: Psychoacoustics Facts and Models I get the critical band data in Bark scale.
Bark scale - Wikipedia, the free encyclopedia
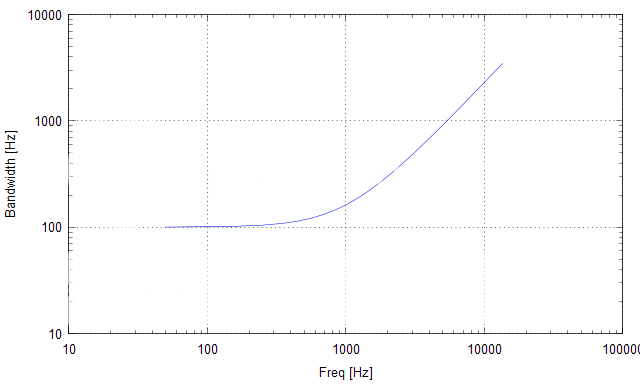
Here's the bandwidth of the critical bands vs frequency:
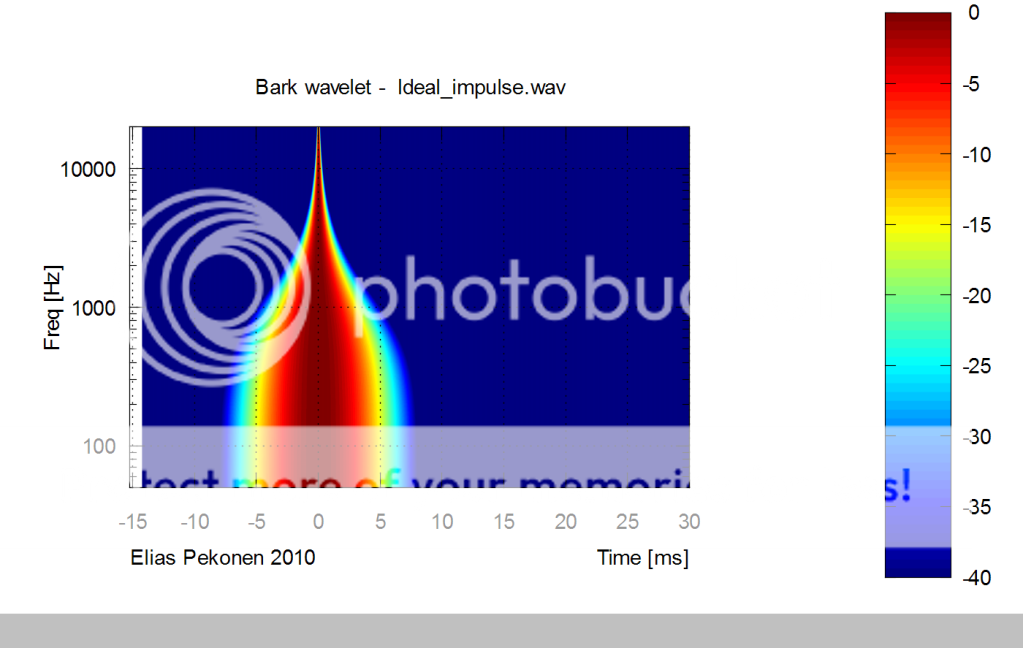
The Bark wavelet looks like this on ideal impulse:
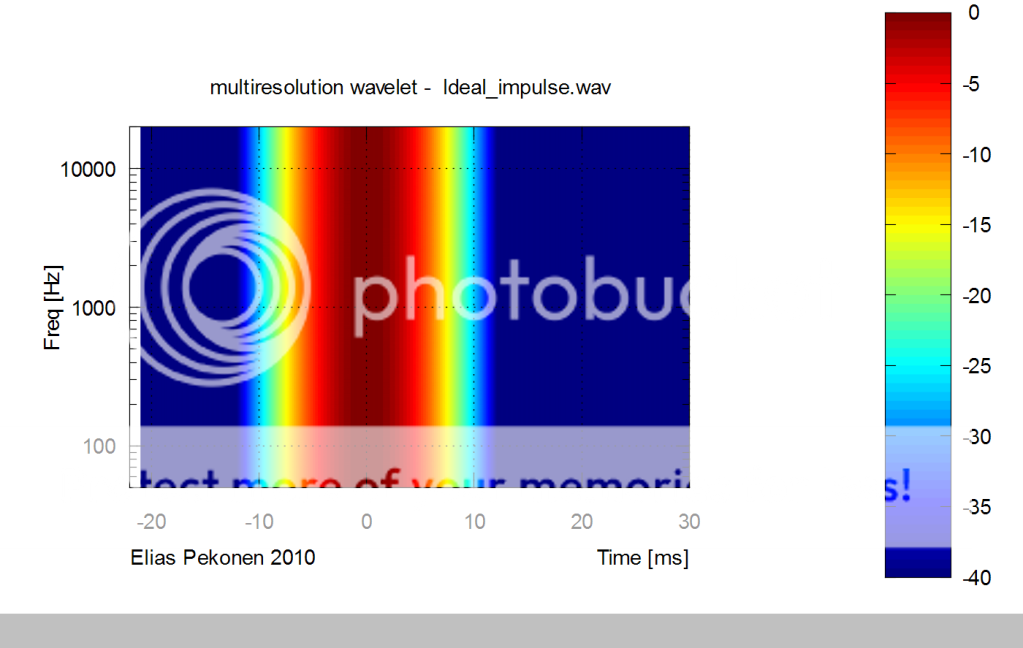
Let's compare it with my previous multiresolution wavelet (CSD equivalent):
And also to constant Q wavelet having 3 cycles:
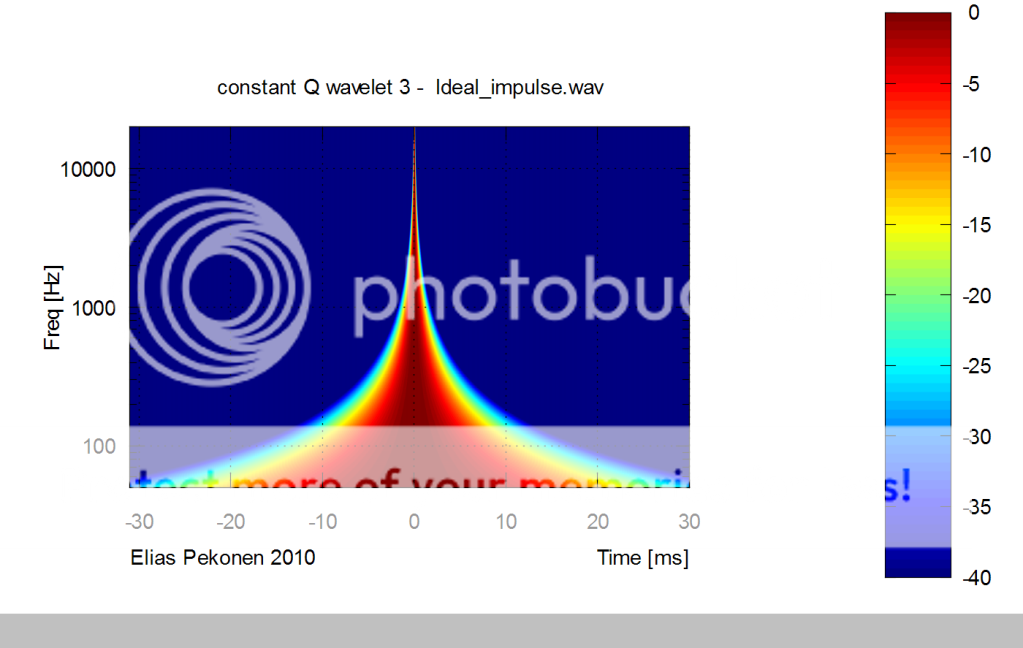
Bark wavelet gives similar behaviour to constant Q at high frequencies, and similar to multiresolution at low frequencies. Sort of best of both worlds
- Elias
Hello everyone,
At the moment I'm experimenting with a new type of wavelet. It's based on human psychoacoustic model. It models the critical bandwidth formed by the basilar membrane in cochlea. Human process broad band sound dividing them into subbands. The idea is to generate wavelets that match the critical bands. I'm expecting this kind of a wavelet to better describe and analyse what is being heard of the impulse response than previous methods (freq response, CSD etc.)
Basilar membrane - Wikipedia, the free encyclopedia
From Zwicker / Fastl: Psychoacoustics Facts and Models I get the critical band data in Bark scale.
Bark scale - Wikipedia, the free encyclopedia
Here's the bandwidth of the critical bands vs frequency:
The Bark wavelet looks like this on ideal impulse:
Let's compare it with my previous multiresolution wavelet (CSD equivalent):
And also to constant Q wavelet having 3 cycles:
Bark wavelet gives similar behaviour to constant Q at high frequencies, and similar to multiresolution at low frequencies. Sort of best of both worlds
- Elias
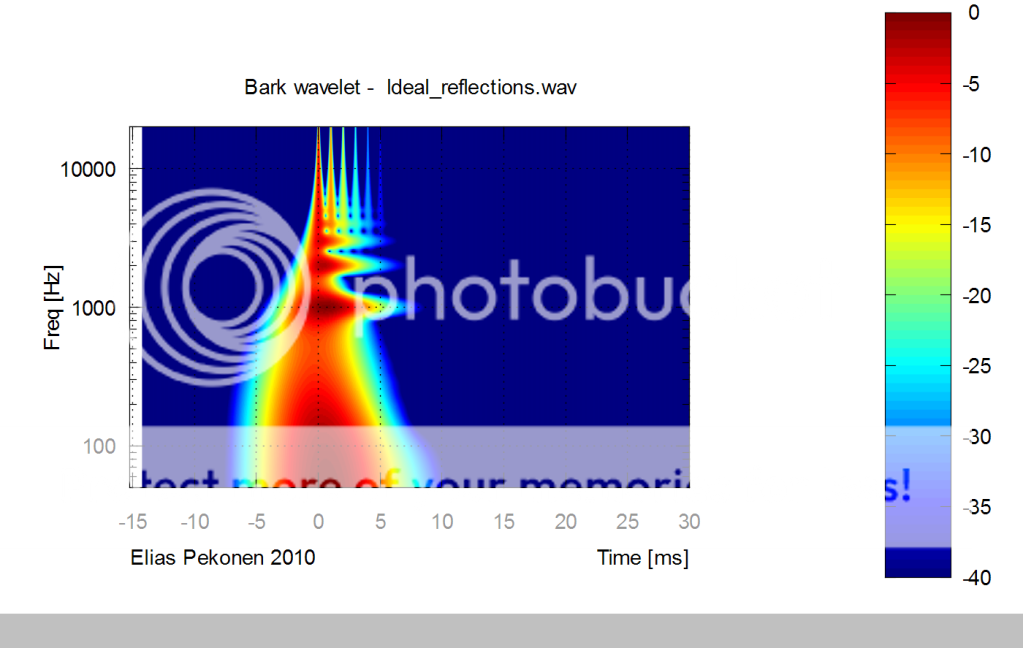
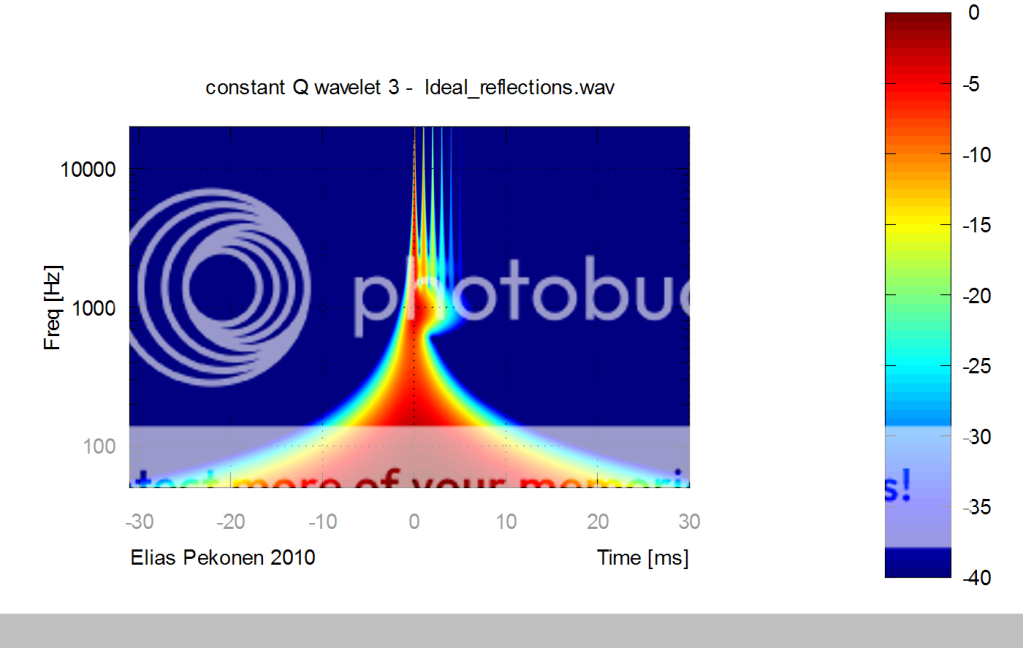
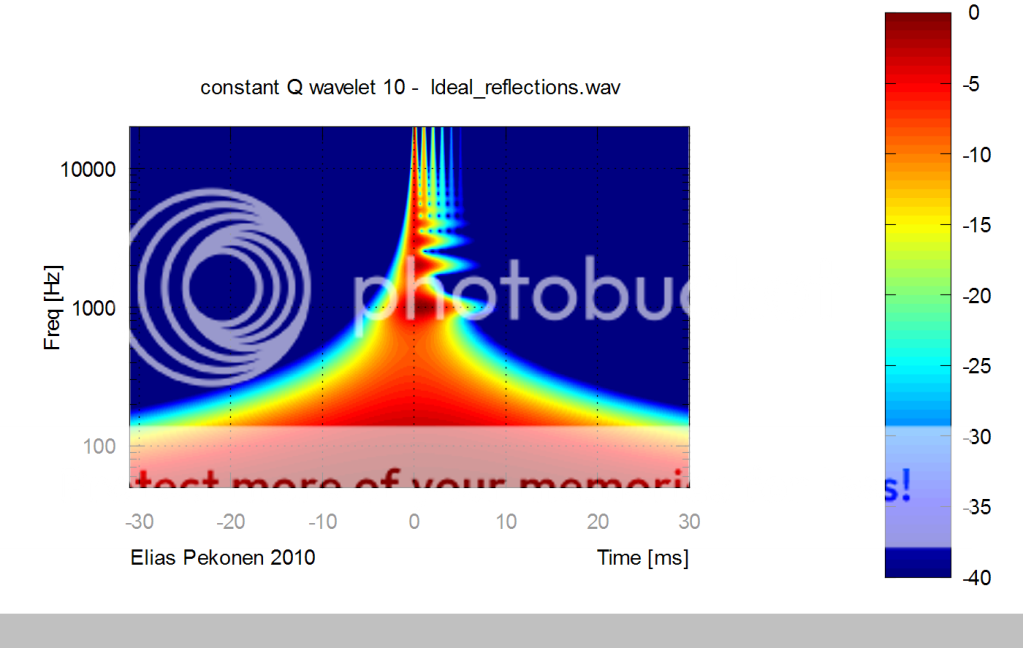
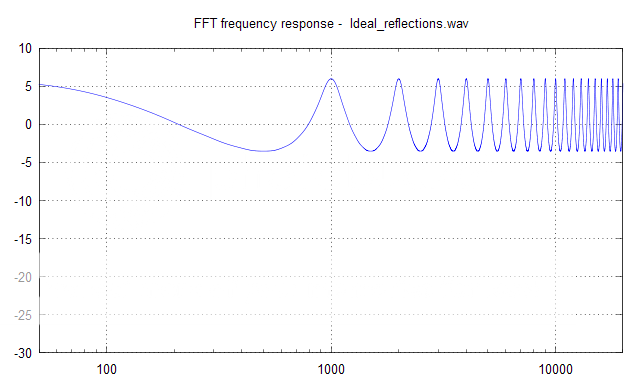
When using my test impulse response consisting of series of reflections between 1ms and -6dB:
http://dl.dropbox.com/u/2400456/diyaudio/Ideal_reflections_16bit_44100.wav
We can compare the wavelet responses:
Bark:
Constant Q with 3 cycles:
Constant Q with 10 cycles:
Multiresolution:
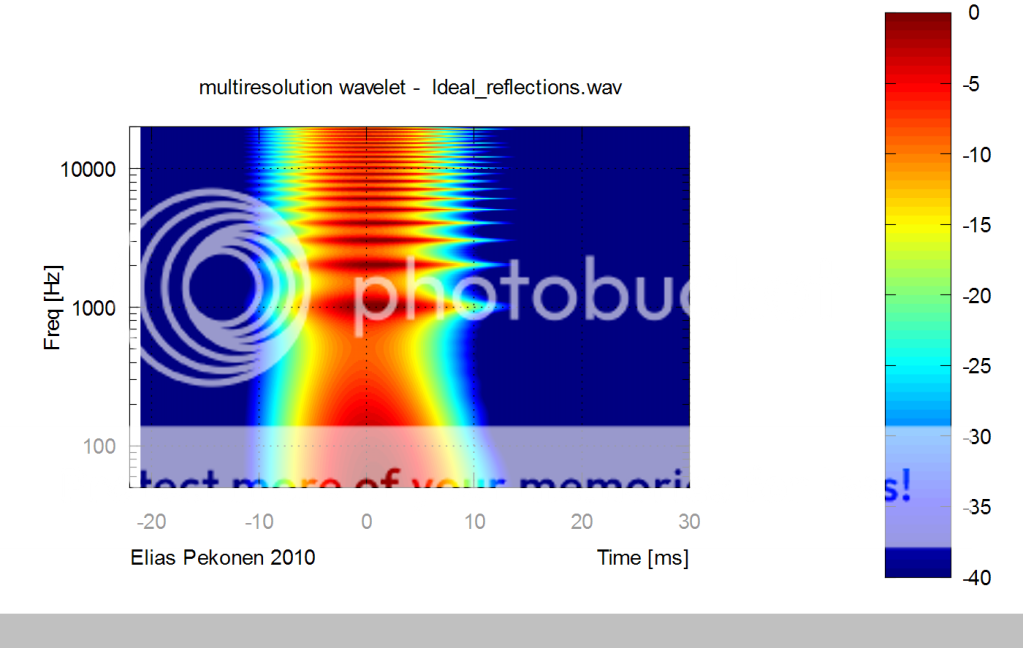
To me it appears the the constant Q is unnecessarily wide at the bottom end. And multiresolution lacks the time resolution at the top end. In this regard the Bark wavelet is an improvement.
- Elias
http://dl.dropbox.com/u/2400456/diyaudio/Ideal_reflections_16bit_44100.wav
We can compare the wavelet responses:
Bark:
Constant Q with 3 cycles:
Constant Q with 10 cycles:
Multiresolution:
To me it appears the the constant Q is unnecessarily wide at the bottom end. And multiresolution lacks the time resolution at the top end. In this regard the Bark wavelet is an improvement.
- Elias
When using my test impulse response consisting of series of reflections between 1ms and -6dB:
http://dl.dropbox.com/u/2400456/diyaudio/Ideal_reflections_16bit_44100.wav
We can compare the wavelet responses:
Bark:
Constant Q with 3 cycles:
Constant Q with 10 cycles:
Multiresolution:
To me it appears the the constant Q is unnecessarily wide at the bottom end. And multiresolution lacks the time resolution at the top end. In this regard the Bark wavelet is an improvement.
- Elias
Your suggestion will be a loooooot of fun for the double blind test freaks to find out - thats for sure !
Really, I still don't see why we need a funny name like CMP. It just creates some illusion that something is happening that has not been identified otherwise.
So after all this talk, the problem is still "how can the source if cause be identified". I don't see the CMP thing addressing the issue. As a matter of fact, I still don't understand what additional issue it's addressing.
Bingo! It's a silly construct that has already been addressed with existing theory. Nothing to see here, move along....
George - I often have problems with your comments, but this one is right on the money. I am watching form the sidelines and the amount of jibberish being spouted here is amazing (John and John being the exception). It's like the better the "pictures" look the more "insightful" they must be! How has any of this led to a better sounding loudspeaker? Any data in that regard?
Heh, I guess I do see things differently quite often. But it's usually because I do get consistent improvement in various areas.
Dare I use wavelett transform to look at calbe performance differences?
But I do find that cable characteristics in the audio range really change. Both measureable and audible. I just haven't figured out what's causing it to change, but I do suspect bending and handling.
But it's usually because I do get consistent improvement in various areas.Dare I use wavelett transform to look at calbe performance differences?
But I do find that cable characteristics in the audio range really change. Both measureable and audible. I just haven't figured out what's causing it to change, but I do suspect bending and handling.
Really, I still don't see why we need a funny name like CMP.
..
As a matter of fact, I still don't understand what additional issue it's addressing.
Bingo!
…
Nothing to see here, move along....
George - I often have problems with your comments, but this one is right on the money.
Show is the key word here. FR is not a void concept with any system.
Not so quick, John.
If I say that I belive you that IR > FR > IR is valid for CMP systems in mathematic terms - I give credit to your math skills (and confess that I'm a math-monkey
).By no menas this implys that FR – with CMP entering the picture - is still valid in visulizing / judging (speaker) performance in the frequency domain *with respect to visualizing spectral distribution in audio, as it is taken for* .
The dilema we have with FR at CMP systems is what I tried to explain above (to JohnPM) with the example :
What pick (window) to take from IR (first impulse only or both impulse) ?
Also the example (in my paper and at our discussion some month ago) of a CMP system with delay time of a full day is a good (but rather extreme) illustration for that same dilemma you have: with CMP systems there are „several FR“ involved.
Sure, you can say that FR concept is always valid in mathematic terms and simply based on IR transformation (and the time window you pick there), but what does this tell us in the end ?
1.) With non-CMP systems we are „only“ limited towards low frequency resolution if we take a too short IR window – *but* - at least we can trust FR to tell us the story of spectral distribution at steady state (which is usually and for most cases „sufficiently“ reached before eternity
) and - due to Non-CMP's continuous spectral development over time (the known log envelope) - even the spectral distribution along time line is fully determined. 2.) With CMP systems we never ever get a valid representation for the systems time behaviour by a simple FR plot – no matter what. This is based on the fact that with CMP systems the spectral distribution over time is a discontinuous one.
You have the choice to display either „FR“ befor CMP discontinuity happens, or you can display „FR“ including CMP discontinuity.
Either way, there is no longer a chance that - whichever „FR“ (of a CMP system) you choose – any of those FR plots tell us the story of „steady state“ nor the story of spectral distribution along time line.
The dilemma of „FR concept“ as the universal tool *with respect to visualizing spectral distribution in audio, as it is taken for* regarding CMP systems IMO is most clearly visualized with the CMP ladder pix.
Hence I stay to my statement that „FR concept is void“ when it comes to CMP systems.
Not in in mathematic terms but in practical ones.
Michael
Last edited:
Michael, It sounds like you are trying to theorize something, yet there is nothing new in theory. For example, based on what you have explained, it would seem like a system with a CSD that looked like a brick wall would be a non-CMP system, a system with a CSD that has a gradual decay is a CMP system. Other than this new name, what are we gaining and how does it help us understand more of what's going on? If there is no hard example, I would really recommend putting this discussion in it's own thread instead of poluting the wavelett thread. Maybe a Philosophy thread?
Speaking of gradual decay and wavelets, has anyone ever made a wavelet from data from data collected near different types of diffusors? I would think a wavelet and IR with just a diffusor as the variable would be most telling about diffusions performance.
Any thoughts on that?
Dan
Any thoughts on that?
Dan
Hi,
I'm glad to hear someone finds the value of looking the data in terms of psychoacoustics
Actually I'm looking forward to get this (or these) wavelets integrated into the Diyaudio wavelet package. Propably I'll write a function that can be added easily.
- Elias
I'm glad to hear someone finds the value of looking the data in terms of psychoacoustics
Actually I'm looking forward to get this (or these) wavelets integrated into the Diyaudio wavelet package. Propably I'll write a function that can be added easily.
- Elias
Elias,
Your findings are how I wish to look at data. Can I contact you about acquiring this capability?
I have asked for just display of bark band tics in SoundEasy, but you have made data interpretation much more easier.
Not so quick, John.
If I say that I belive you that IR > FR > IR is valid for CMP systems in mathematic terms - I give credit to your math skills (and confess that I'm a math-monkey
By no menas this implys that FR – with CMP entering the picture - is still valid in visulizing / judging (speaker) performance in the frequency domain *with respect to visualizing spectral distribution in audio, as it is taken for* .
The dilema we have with FR at CMP systems is what I tried to explain above (to JohnPM) with the example :
What pick (window) to take from IR (first impulse only or both impulse) ?
Also the example (in my paper and at our discussion some month ago) of a CMP system with delay time of a full day is a good (but rather extreme) illustration for that same dilemma you have: with CMP systems there are „several FR“ involved.
Sure, you can say that FR concept is always valid in mathematic terms and simply based on IR transformation (and the time window you pick there), but what does this tell us in the end ?
1.) With non-CMP systems we are „only“ limited towards low frequency resolution if we take a too short IR window – *but* - at least we can trust FR to tell us the story of spectral distribution at steady state (which is usually and for most cases „sufficiently“ reached before eternity
2.) With CMP systems we never ever get a valid representation for the systems time behaviour by a simple FR plot – no matter what. This is based on the fact that with CMP systems the spectral distribution over time is a discontinuous one.
You have the choice to display either „FR“ befor CMP discontinuity happens, or you can display „FR“ including CMP discontinuity.
Either way, there is no longer a chance that - whichever „FR“ (of a CMP system) you choose – any of those FR plots tell us the story of „steady state“ nor the story of spectral distribution along time line.
The dilemma of „FR concept“ as the universal tool *with respect to visualizing spectral distribution in audio, as it is taken for* regarding CMP systems IMO is most clearly visualized with the CMP ladder pix.
Hence I stay to my statement that „FR concept is void“ when it comes to CMP systems.
Not in in mathematic terms but in practical ones.
Michael
Michael,
Please look at this picture:

Red is obviously the raw dipole, Blue the raw dipole with LP filter, Green the raw dipole with LP filter and EQ'ed to flat. Would you honestly say that you can not make an evaluation of which of these would be acceptable for a loudspeaker? Each is MP and each have the impulse response that is the IFFT of the FR. And each will have the impulse response of any other MP system with the same FR.
Regarding what window to use to generate the FR, aren't you just mixing works here? What window would you use for impulse in the WTF? Windows are chosen based on what we want to look at, not what analysis we will apply. If we are interested in the anechoic response of the system we measure in an anechoic environment or we window out the room related reflections. We don't window out part of the system impulse. And remember that paper I referenced, efficient calculation of the WTF performs the convolution in the frequency domain. That is it uses FFT(IR), not the IR directly. So, what ever the length of the IR used in the WFT, it is transformed to the FR first. So before you even start the WTF you will typically have an opportunity to look at the FR. I would certainly look at the FR before jumping to the WTF.
Now you have invented the term CMP for some reason, and you wax on endlessly about how this or that isn't a valid representation of the system and I have replied that it is and indicated why. Your problem seems to reflect a lack of consideration of what the system is. If the system has a double impulse, then you can not arbitrarily window out the second (or first) impulse and understand the system at all. Again, when you ask what window to use, the same applied to your CMP. Windowing is used to remove those aspects of the impulse with would contaminate the information we are interested in. If, for example, we were interested in the complete room response at some position we would (do) use a very long window for the impulse. The same applies to the WTF. Do you want to look at the speaker or the entire room?
Lastly, as long as it is only the speaker we are interested in then ask yourself what is the difference between an OB or dipole system and a conventional speaker in an anechoic environment? Basically the difference is only in the strength of the second impulse. The OB generally has a second impulse that is twice as strong as the conventional speaker. That is about it. In an OB system, the impulse form the rear is basically the response of the driver at 90 degrees off axis wrapping around the baffle. With a conventional speaker it is the 90 degree response of the driver diffracted from the baffle edge. When you look at this, particularly at low frequency, the only real difference in the strength of the impulse. They both have the same spectral content, assuming the rear of the driver radiates the same response as the front. Look at this figure:

All your arguments are just running in circles. The bottom line is that what is in the windowed impulse is in the FR and if the impulse is windowed the same for the WTF the same information is in the WTF plot. The WTF is just a display mechanism. Fundamentally it shows a pretty plot.
As I have said repeatedly, the WTF is another tool and it might be useful, but before a speaker design gets to the point where it might be of use you should probably focus on the on axis and polar response. Looking at the WTF of a double, inverted, perfect impulse is fine to demonstrate what the WTF does, but it has little relevance to any real world loud speaker. The red (and blue) lines in my first plot certainly would NOT be be acceptable FR responses for a loudspeaker so I would not base any arguments on what the impulse of those responses looks like when passed through a WTF analysis.
- Status
- This old topic is closed. If you want to reopen this topic, contact a moderator using the "Report Post" button.
- Home
- Loudspeakers
- Multi-Way
- WTF!? Wavelet TransForm for audio measurements - What-is? and How-to?