Isn't this exactly what I've been saying for the last couple of days ? That as you get too close to an acoustically large source the SPL won't increase as much as expected since you're in the near field, and the measurement will be in error such that it can't be extrapolated into the far field.
The first link posted by Tom Danley spells all this out in excellent detail as well as a number of bounding conditions that need to be satisfied to be sure you're within the far-field of a given speaker at the frequencies you're measuring at.
A useful rule of thumb given in the article for low frequencies is that you want to be at least 3 times the largest active dimension of the speaker away to ensure that you're not in the near-field. Funnily enough I've already come across this rule of thumb a long time ago, (although expressed as 6 times the driver radius) and try as much as possible to stick to it.
By this rule of thumb a bass horn with a ~1 metre tall mouth such as the 12pi shouldn't be measured any closer than ~3 metres if you want to be able to accurately extrapolate the data to greater distances, regardless of whether the acoustic centre source depth is known accurately or not.
By this same rule of thumb the absolute largest driver you could measure at 1 metre and still be able to extrapolate the SPL data at a distance accurately (or compare accurately to another speaker of largely differing size) is a 15" woofer, whose active cone diameter is a little over 30cm.
Yet you stated further back in the thread that you see no problem with taking a measurement at 1 metre from a bass horn that has a 1 metre wide or high mouth - something that violates this 3 to 1 rule by a factor of three.
It's convenient of you to just average the two results and say "look, it's 1dB away from inverse square law fall off". Did it occur that the cause of the 2dB difference in fall off between 50Hz and 125Hz on the horn might be a result of the acoustic centre of the horn shifting with frequency ?
At 50Hz one horn by itself is very likely compromised, bringing the acoustic centre forward somewhat, while at 125Hz it will be a lot closer to being un-compromised and pushing the acoustic centre back towards the driver.
If the acoustic centre was further forward at 50Hz, you would expect more total fall off from near to far, because you're going from ~1 metre to ~32 metres, whilst at 125Hz you're going from maybe ~1.5 metres to ~32.5 metres with the same microphone locations. This is consistent with the 2dB difference, and in the right direction, however its probably within the error margin of the measurements.
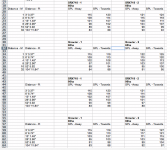
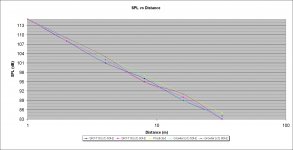
I think it's helpful to look at graphs rather than raw numbers to see what's really going on and whether the measurements deviate or not, so I took the liberty of putting your measurements into an excel spreadsheet and graphing them, which I've attached as two images.
The yellow line is the predicted theoretical inverse square law fall off. The first graph has a linear distance axis while the second has a logarithmic distance axis, which is convenient because it makes inverse square law fall off a straight line, making it easier to see how the measurements deviate from the predicted response.
There is a huge periodic wiggle in the readings between 2 and 8 metres, presumably from a building reflection. The magnitude of the deviations is far greater than the small difference we're trying to measure which is probably only on the order of 2dB or so. Even at 32 metres the slope of the lines have not converged at the correct inverse square law fall off on 3 of the 4 measurements.
The fact that the horn at 125Hz follows most closely with the predicted response suggests that the directivity of the horn at that frequency is reducing the magnitude of some off axis reflection.
The inescapable conclusion is that there is far too much experimental error in the measurements (probably reflections) to provide any meaningful confirmation or denial of the facts being argued over. I have to agree with Wayne that your measurements in this particular instance don't prove anything one way or the other.
My own inverse distance tests were flawed, I posted them simply in response to Wayne saying I had manipulated the results, which is a lie.
You statement “The fact that the horn at 125Hz follows most closely with the predicted response suggests that the directivity of the horn at that frequency is reducing the magnitude of some off axis reflection.” is exactly right.
The small bass reflex speaker is virtually omni at 125 Hz, so the reinforcement of the walls of my shop and casita (small house) ended up reinforcing that frequency more, which resulted in near field higher relative to the far field.
I prefer to refer to Phil’s measurements, which were done with no buildings in the vicinity.
They were performed with subs of similar radiating surface, also an important consideration, and two each of the subs, together having similar frontal area to a 12Pi.
In regard to full range frequency measurements, Pat Brown wrote :
"A working “rule-of-thumb” for determining the boundary between near-field and far-field is to make the minimum measurement distance the longest dimension of the loudspeaker multiplied by 3. "
He then writes:
"It is often thought that a remote measurement position is necessary for low frequencies since their wavelengths are long. Actually the opposite is true. It is more difficult to get into the far-field of a device at high frequencies, since the shorter wavelengths make the criteria in Item 4 more difficult to satisfy.
4. The distance from the source where the path length difference for wave arrivals from points on the device on the surface plane perpendicular to the point of observation are within one-quarter wavelength at the highest frequency of interest (Figure 2)."
This is an important distinction between high frequency and low frequency measurement, criteria #4 can be satisfied at 95 Hz for a subwoofer of one square meter measured at one meter.
Thank you for taking the time to review my data.
I would really appreciate your putting Phil Lewandowski’s data into the excel spreadsheet and graphing them, that would be quite informative.
Art Welter
You see, Art, that's part of the equation, a big part. The mouth size is a key component of the acoustic center. It is also about path length and flare profile. The acoustic center will shift as a function of frequency due to each of these things.
A horn has area expansion, so even inside it, it is starting to have pressure attenuation down the length of the horn. This is part of the equation. Another part of the equation is mouth size with respect to wavelength, which determines whether or not it functions as a diffraction slot. At frequencies where the mouth is acoustically large, the acoustic center shifts towards the apex of the throat. At frequencies where the mouth is acoustically small, the acoustic center shifts towards the mouth.
Even a simple direct radiator has an acoustic center that is not necessarily obvious by looking at it. That's what was mostly focused on in the articles Tom posted. It's shown in a different way than the Jacobsen-Figueroa-Rasmussen document, but the problem being described is similar, as is the proposed solution. That's why even direct radiating subs need to be measured at a distance, otherwise the results will not scale.
All of these things play a role. They make a big difference in the scale of the SPL measured at 1M verses at 10M.
And by the way, Art, I'm sorry if I was hard on you at times about your measurements. It's just that you were so insistent that you had "proven" something, yet I could see your data was flawed. This concept isn't anything new, everyone that does measurements of this sort understands path-length error and works with it. So for you to continually say you had proven this concept to be a myth and to keep saying it over and over and over again was a little frustrating to me. I did not want a misconception to be spread in a thread about my 12Pi hornsub.
Last edited:
Error ?
As far as i'm aware, ALL manufactures of Horn etc systems since way back when, have published SPL data @ 1W/1M taken from the center of the mouth exit.
Which would mean "if" this is not the correct method, they have ALL been in error for a Very long time ! This includes JBL/EV etc etc. Makes ya think.
Olson (RCA)
Posted by djk(M) on January 9, 2010 at 00:10:01
In Reply to: Horns, listening distance and DSP posted by Frode on January 8, 2010 at 03:22:53:
Horns can sound like they have no bass right up close, this strange phenomenon can be heard when walking up to a mono Klipschorn with the HF disconnected.
Olson, section 1.5, Fig. 1.2, 1.3
Up close the phase angle between the pressure and the particle velocity in a spherical sound wave is 90°, this corrects itself at at a distance as it becomes a plane wave.
The charts show phase angle vs distance and particle velocity vs distance. Distance in both cases expressed as (2Pi/W)D, wavelength and distance assumed to be in feet.
For a 10° difference at 40hz it works out to like 22.5 feet.
For a 30° difference at 40hz it works out to like 8.2 feet.
The ratio of the absolute magnitude of the particle velocity to the pressure starts to flatten out beyond 8.2 feet for 40hz.
The very high losses at low frequencies would indicate that mic in the mouth is meaningless, but should be measured at a great distance and use inverse square to find the 1M spl (which is standard).
I've had people come up to me and tell me they couldn't hear anything coming out of a cabinet, it must be blown (yet it's pounding in the back of the room).
As far as i'm aware, ALL manufactures of Horn etc systems since way back when, have published SPL data @ 1W/1M taken from the center of the mouth exit.
Which would mean "if" this is not the correct method, they have ALL been in error for a Very long time ! This includes JBL/EV etc etc. Makes ya think.
Actually, they measure at a distance and then calculate back. As an example, since the falloff of sound is 6dB for every doubling of distance, you can measure say 8 meters away and then add 18dB for a calculated 1M value. Another convenient distance is 10 meters, which is -20dB from the 1M value. Since 100w is 20dB greater than 1W, if you measure at 10M using a drive signal of 100W, the value is conveniently equivalent to the 1W/1M value, but scaled properly to avoid path-length error. Everyone lists 1W/1M values, but the actual measurement is made much further away and scaled back.
By measuring at a 10M distance, you can find the 1W/1M value without having to precisely know the positions of the acoustic centers of the microphone and of the speaker. The acoustic centers at large distance can be assumed to be the face of the cabinet, or its center, and a few feet of difference either way won't matter much. The 10M distance to the microphone makes a +/- 50cm error meaningless.
Wayne,You see, Art, that's part of the equation, a big part. The mouth size is a key component of the acoustic center. It is also about path length and flare profile. The acoustic center will shift as a function of frequency due to each of these things.
And by the way, Art, I'm sorry if I was hard on you at times about your measurements. It's just that you were so insistent that you had "proven" something, yet I could see your data was flawed... So for you to continually say you had proven this concept to be a myth and to keep saying it over and over and over again was a little frustrating to me.
Apology accepted.
I wrote from the get go that my inverse distance test was flawed due to the proximity of buildings to the sub and the front loaded sub being overdriven, which is why I have posted Phil Lewandowski’s data.
Phil's data is not flawed. It is averaged to the nearest dB, so there will be a little "up and down" compared to the predicted inverse distance, but overall the data points are show conformity to the inverse distance law from 1-32 meters within about one dB.
His test was well executed in an area free of reflections. I initially planned to repeat my test under better conditions, but Phil tested before I had time to do so, making another test by me redundant.
It would be interesting for you to post what you predict the 12Pi's level change would be from 1 to 32 meters, then do an actual test (as we did with our cabinets) to compare your predictions to the measured results.
The 12Pi, being around four times the size, and 1/3 (or more) longer path length might not conform as exactly to the inverse distance law as the JTR Growlers and JBL SRX 718s that Phil tested did.
The difference (if any) you find would be a useful comparative metric.
Art Welter
Attachments
I've done an initial graph of some of the figures, and there are some discrepancies in the results, but I'm unsure about which sets of figures I should be using, and what they represent so I'll get some more details from you first.I prefer to refer to Phil’s measurements, which were done with no buildings in the vicinity.
They were performed with subs of similar radiating surface, also an important consideration, and two each of the subs, together having similar frontal area to a 12Pi.
[...]
Thank you for taking the time to review my data.
I would really appreciate your putting Phil Lewandowski’s data into the excel spreadsheet and graphing them, that would be quite informative.
In particular - the significance of the "towards" and "away" columns of measurements - I presume towards was a normal on axis measurement, while away is from the back of the cabinet ? If so I'm not sure that we need to graph the backwards facing response, as its not really relevant to this discussion ? (Too many lines on the graph just makes a big mess that's hard to interpret)
Then there is the - 1 and -2 version of each measurement - eg Growler -1, Growler -2 etc, is this just two sets of measurements of two different cabinets of each type taken one at a time, or is -1 with one cabinet by itself and -2 with two of the same cabinets stacked and both in operation ?
If so, the figures for SRX718-2 at 90Hz are missing, making any graphing of the -2 sets of figures incomplete. (In my first pass graph I graphed the "Towards", "-1" figures for both frequencies and both drivers)
At what distance were the SPL levels matched for the two different cabinet designs ? At 32 metres or 1 metre ? It appears that at least for some of the results, the levels were matched at 32 metres, but my graph shows a lot of inexplicable fluctuation in readings between 4 and 16 metres that cast doubt on the 32 metre readings.
Lastly, I'm not familiar with either of the speakers, so I've googled them to find out what they are, so just to confirm, is the first one a JBL SRX718 18" bass reflex, and the second one the JTR Growler horn ?
Although the JTR website claims its a 7 foot folded horn, the mouth area is a relatively small 50cm x 50cm, so unless you had a lot of them stacked together we're back well into "compromised horn" territory, with the attendant forward shift of the acoustic centre. In other words I'm not sure that they're representative of the acoustic centre of a bass horn that is actually acting as a horn.
Last edited:
I wrote from the get go that my inverse distance test was flawed due to the proximity of buildings to the sub and the front loaded sub being overdriven, which is why I have posted Phil Lewandowski’s data.
Phil's data is not flawed. It is averaged to the nearest dB, so there will be a little "up and down" compared to the predicted inverse distance, but overall the data points are show conformity to the inverse distance law from 1-32 meters within about one dB.
His test was well executed in an area free of reflections. I initially planned to repeat my test under better conditions, but Phil tested before I had time to do so, making another test by me redundant.
Art, you need to stop pressing this argument, It is a flat-earth argument, and you need to simply drop it.
I don't want to saying anything disparaging or to attack you personally, but this is extremely frustrating because what you are doing is wrong. To try and cast doubt on the concept of the acoustic center, to try and take a positon that 1W/1M values measure the same as more distance measurements, these things are incorrect and may confuse those that have little experience in this matter.
If Phil's data shows no difference in the scale of the SPL at 1 meter as it does at 10 meters, then absolutely it is flawed. I can tell you for certain that the cabinets you're talking about have a different SPL at 1W/1M than they do at 100W/10M. Even a simple vented 2226 shows a very different value at 1M with 1 watt input than it does at greater distance. So if his tests show otherwise, they're flawed.
Honestly, Art, you simply must stop this. I don't like it when this discussion goes downhill, and it has already been a colossal waste of time, with over ten pages of you insisting the inverse-square law starts at the mouth. Several of us have shown you numerous references why this does not happen, yet you still haven't relented.
The data you have wasn't gathered under the best conditions, to put it very mildly. Instead of assuming you have discovered all the textbooks are wrong, you should be suspicious of your data. That's the obvious anomaly here.
What you probably should do - instead of continuing here - is to go back to each and every messageboard thread where you have referenced this data and post a correction or addendum. It should say something to the effect that either the test equipment or the test conditions were flawed and the data should be considered to be anomalous. Provide links to the documents referenced here that show the reasons SPL doesn't scale when measurements are made too close. That would be the best thing you could do, because it would help reduce confusion for anyone else reading those threads later.
I've done an initial graph of some of the figures, and there are some discrepancies in the results, but I'm unsure about which sets of figures I should be using, and what they represent so I'll get some more details from you first.
In particular - the significance of the "towards" and "away" columns of measurements - I presume towards was a normal on axis measurement, while away is from the back of the cabinet ? If so I'm not sure that we need to graph the backwards facing response, as its not really relevant to this discussion ? (Too many lines on the graph just makes a big mess that's hard to interpret)
Then there is the - 1 and -2 version of each measurement - eg Growler -1, Growler -2 etc, is this just two sets of measurements of two different cabinets of each type taken one at a time, or is -1 with one cabinet by itself and -2 with two of the same cabinets stacked and both in operation ?
If so, the figures for SRX718-2 at 90Hz are missing, making any graphing of the -2 sets of figures incomplete. (In my first pass graph I graphed the "Towards", "-1" figures for both frequencies and both drivers)
At what distance were the SPL levels matched for the two different cabinet designs ? At 32 metres or 1 metre ? It appears that at least for some of the results, the levels were matched at 32 metres, but my graph shows a lot of inexplicable fluctuation in readings between 4 and 16 metres that cast doubt on the 32 metre readings.
Lastly, I'm not familiar with either of the speakers, so I've googled them to find out what they are, so just to confirm, is the first one a JBL SRX718 18" bass reflex, and the second one the JTR Growler horn ?
Although the JTR website claims its a 7 foot folded horn, the mouth area is a relatively small 50cm x 50cm, so unless you had a lot of them stacked together we're back well into "compromised horn" territory, with the attendant forward shift of the acoustic centre. In other words I'm not sure that they're representative of the acoustic centre of a bass horn that is actually acting as a horn.
Simon,
You are correct, the cabinets are the JBL SRX 718 18" bass reflex, and the the JTR Growler .
Wayne has tested the JTR Growler and the JBL SRX 728, the “big brother” of the 718 in some of his Pro Sound Sub shootouts, so these tests are relevant to the discussion in many respects.
In Results - Small Horn vs. Small Direct Radiator SPL fall-off [message #551418 is a reply to message #548404 ] Thu, 27 May 2010 15:53
Phil Lewandowski wrote:
“When I went from 1 to 2 subs, I kept the drive voltage the same from the previous single sub test I just ran.
For starting at 1M, the single sub SPL 115dBC. And the starting SPL at 32M was 88 dBC.
From looking over the data very quickly, the total fall-off ranged from 30dB to 32dB. Where 30dB was the "theoretical" book value.
Interestingly, the only pure 30dB fall-offs where with 2 subs, while going towards the sub. We forgot to do the 2 SRX 718 going towards so that is why there is no data there, unfortunately.
Honestly though, I can't see anything conclusive to come to any real conclusions, from what I see. Maybe someone else will be able to point out something interesting!
Take Care,
Phil”
Phil’s tests give a much larger data set than my flawed test, the “Away” test is the same protocol I used, set a level at 1 meter, then move the dB meter away from the front of the cabinet doubling distance up to 32 meters.
The “Towards” is basically the same test, but the level was set at 32 meters, and the dB meter towards the front of the cabinet halving the distance each test till 1 meter from the cabinet front.
The JTR Growler is “compromised” as is any horn with a mouth under a full wavelength in diameter is.
Obviously, that compromise is one accepted by any builder of portable bass horns, an 8.7 meter diameter mouth for a 40 Hz horn could not be carried on our roads.
Fortunately, horns still “work” down to a 1/4 wavelength, so a 2.2 meter diameter collection of compromised horns still provides decent 40 Hz response.
In singles, as can be seen by any of the 12Pi graphs, the 40 Hz response will be far less than at 100 Hz, as in any “compromised” FLH.
I hope I have answered all your questions, have to take off for a show.
I will be looking forward to the graphs of Phil’s data, they should throw more light on the subject of where the inverse distance law starts for horns and front loaded cabinets.
Art Welter
I'm not familiar with either of the speakers, so I've googled them to find out what they are, so just to confirm, is the first one a JBL SRX718 18" bass reflex, and the second one the JTR Growler horn ?
That's right. The SRX718 is a JBL 2268H in an 8ft3 (225 liter) box. An excellent little subwoofer, by the way, with "differential drive". That's an implementation of push-pull drive built into the motor, using a pair of voice coils.
The JTR Growler is also a very good subwoofer, especially for its size. I've measured a lot of basshorns, and most that are small are pretty peaky but this one isn't.
Although the JTR website claims its a 7 foot folded horn, the mouth area is a relatively small 50cm x 50cm, so unless you had a lot of them stacked together we're back well into "compromised horn" territory, with the attendant forward shift of the acoustic centre. In other words I'm not sure that they're representative of the acoustic centre of a bass horn that is actually acting as a horn.
Well, that's true. It is small for a horn, but its passband is a little higher which relaxes some of the size requirement. As I said, it's pretty smooth for a small horn. As with all basshorns, you'll get better performance in groups but I think it's acceptable even in small clusters, like just a pair. You trade some efficiency and some deep extension for size.
On the matter of the acoustic center, I agree with you that the horn is too small for its inverse-square source location to be fully 7 feet back when just used in singles or even doubles. But it is definitely down the throat a ways, even when just one or two are used. You can tell it when you get up close to one. It isn't as far back as a larger horn, but it is definitely doing the "far-way acoustic center" thing.
Then again, the direct radiating sub also has some acoustic center offset too. When you get up close, it is definitely loud, and when compared to a hornsub, this is most noticeable. So I doubt the acoustic center is back as far, but it definitely isn't at the face.
It appears that at least for some of the results, the levels were matched at 32 metres, but my graph shows a lot of inexplicable fluctuation in readings between 4 and 16 metres that cast doubt on the 32 metre readings.
Yes, the data is definitely anomalous.
Last edited:
It appears that at least for some of the results, the levels were matched at 32 metres, but my graph shows a lot of inexplicable fluctuation in readings between 4 and 16 metres that cast doubt on the 32 metre readings.
As I understand, Phil's data was gathered using a Radio Shack sound meter. It is maybe useful for course measurements but I'm not sure how useful it is for this sort of thing. The meter bounces all over the place.
In a measurement system like LMS, the fundamental is tracked with with a steep bandpass filter when doing a sweep. That greatly improves the signal-to-noise ratio because the only thing that is being sensed is the frequency of interest. But when using a sound meter, this isn't possible. So noise immunity is a problem for a SPL meter, unless sound pressure levels are high.
Last edited:
Ok that does clear up a few things, particularly "Away" vs "Towards", which I had completely misinterpreted.Simon,
Phil Lewandowski wrote:
“When I went from 1 to 2 subs, I kept the drive voltage the same from the previous single sub test I just ran.
For starting at 1M, the single sub SPL 115dBC. And the starting SPL at 32M was 88 dBC.
From looking over the data very quickly, the total fall-off ranged from 30dB to 32dB. Where 30dB was the "theoretical" book value.
Interestingly, the only pure 30dB fall-offs where with 2 subs, while going towards the sub. We forgot to do the 2 SRX 718 going towards so that is why there is no data there, unfortunately.
Honestly though, I can't see anything conclusive to come to any real conclusions, from what I see. Maybe someone else will be able to point out something interesting!
Take Care,
Phil”
Phil’s tests give a much larger data set than my flawed test, the “Away” test is the same protocol I used, set a level at 1 meter, then move the dB meter away from the front of the cabinet doubling distance up to 32 meters.
The “Towards” is basically the same test, but the level was set at 32 meters, and the dB meter towards the front of the cabinet halving the distance each test till 1 meter from the cabinet front.
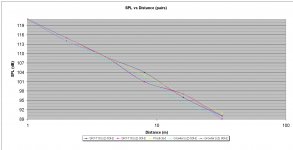
From that I've opted to graph the "Away" figures which were level matched at 1 metre, both for consistency with your measurements, as well as the fact that one of the "towards" measurements is missing. I've also only bothered with a logarithmic scale this time, as I think it's the more useful of the two scales visually.
I've used all the figures as presented with one slight adjustment - although Phil has level matched the JBL and the Growler to 115dB at 1 metre as individual units, according to his description and as is apparent in the figures, the levels have not been matched again after switching to pairs of units.
Since we're looking for any differences in fall off rate between the JBL and Growler with both starting at the same SPL at 1 metre, I've subtracted 1dB from the 60Hz Growler pair figures, and 2dB from the 90Hz Growler pair figures so that they all start at 121dB at 1m.
(As an interesting aside, I assume the fact that the 2x bass reflex cabinets only gain the expected 6dB over one cabinet, whilst the 2x horns gain 7dB and 8dB at 60Hz and 90Hz respectively is because the larger total mouth area is making the combined horn less compromised, thus raising their individual efficiency
") )
)So what do we see ? In the first graph there does appear to be a difference in the slope of the fall off between 1 metre and 2 metres, with the JBL showing a steeper line which would suggest that the measurement position was closer to the acoustic centre. (Since the rate of increase of SPL with distance accelerates as you get closer)
I would caution though that since all the figures are rounded to the nearest 1dB and the difference at 2 metres is only 1dB, it's within the experimental error...
The other thing I notice is the wiggles in response from 2 metres onwards which in some cases amount to a 2dB p-p variation. If the measurement was done well away from any buildings this wiggle shouldn't be there, unless there was a ground reflection.
So do we know whether Phil had the microphone on the ground to eliminate the ground reflection, or was it up in the air a bit ? Because the error is +/- 1dB it could again be rounding error, or +/- 1 error from the SPL metre if it only had a 1dB minimum step size. If the SPL metre did report fractional values, it's a shame we don't have those more accurate figures to see if the wiggle is really there or whether its just a +/- 1 digit error. Their periodic wave shape does tend to make me think they are real and caused by a "floor bounce" ground reflection though, especially when the 60Hz and 90Hz peaks and dips occur at different distances.
The second graph shows similar but different fluctuations, reaching 3dB p-p in one case. None of the graphs show the correct figure at 32 metres - in most cases the difference between measured and predicted value is 2dB, with the measured figure at 32 metres always being too low.
While interesting, I'm not sure that we can conclude anything from these graphs. While there are differences between the speakers, the magnitude of the difference we're looking for is probably in the order of 2dB or so, yet we only have figures rounded to the nearest dB, along with what looks like a ground reflection.
I'd have to call it inconclusive.
Attachments
Last edited:
I hope this isn't too off-topic.
Does this theory also apply for tapped horns as well? I mean, will a tapped horn measure more like a FLH or a BR, as you get closer to its mouth?
I wonder since i'm trying to figure out if a BR will do better than my tapped when i do small parties/venues, where people are always really close to the stacks. If i get this right, a BR will sound louder than a FLH when close to it, and therefore have an advantage at that point?
Measuring at a distance is a good idea no matter what speaker type you're working with. The whole point of measuring at a distance is to make the position accuracy required of the acoustic centers less important. Large distances reduce path-length/acoustic-center error because they scale the distances involved and make small errors insignificant.
So what do we see ? In the first graph there does appear to be a difference in the slope of the fall off between 1 metre and 2 metres, with the JBL showing a steeper line which would suggest that the measurement position was closer to the acoustic centre. (Since the rate of increase of SPL with distance accelerates as you get closer)
The other thing I notice is the wiggles in response from 2 metres onwards which in some cases amount to a 2dB p-p variation. If the measurement was done well away from any buildings this wiggle shouldn't be there, unless there was a ground reflection.
I'd have to call it inconclusive.
I would agree with you that Art and Phil's data is inconclusive, and doesn't prove or disprove anything. But since I have a great deal of experience with measurements of this sort - and I know that 1M measurements are much further off the line-of-scale than this - I am easily able to draw a conclusion, and that is the data is flawed. It may be that the meter movement was misread, or it may be something else. But this data is off, way off.
In Phil's test, he was using a Radio Shack sound meter, which should probably only be trusted to within about 6dB. At close ranges, the acoustic center problem makes measurements ambiguous. At greater distances, the signal-to-noise makes measurements ambiguous. The meter moves all over the place, so if you stand there and look at it bouncing, you can sort of pick a value between the high and low movements of what is a pretty large window, like about 4dB to 6dB or so. Then add to that the fact that Phil already assumed he should find a constant falloff:
From looking over the data very quickly, the total fall-off ranged from 30dB to 32dB. Where 30dB was the "theoretical" book value.
Here we see that Phil's expectation was that the fall-off would be constant. So when the meter is bouncing up and down 6dB, I can understand why he might pick values that met his expectation. As I said earlier, I think Art and Phil were working with a preconceived notion, and that they saw what they wanted to see.
Phil did not understand that the "theoretical" book value actually includes acoustic center ambiguity, and so each cabinet should probably be off-scale at close range. Had he known that, I am not so sure he would have picked numbers from the bouncing meter movement that appeared to maintain the inverse-square relationship when the microphone was very close.
The "theoretical" book value tells us that the inverse-square law applies several meters back, but at close distances, the measurement will appear to deceive us because we do not precisely know the acoustic centers, so we do not precisely know where to place the microphone. In some cases, it will be one meter from the face, but in most cases it will be either closer or further and in many cases it will be impossibly close, like inside the cabinet.
At close distances like one meter, the acoustic center offset isn't just a few inches off, it's often several feet. Sometimes - often - the distance error is greater than the measurement distance, which is why the numbers can be so far off.
Accurate measurements confirm this. That's why I have been so amazed at the length of this "argument". It's over ten pages now, just on acoustic center ambiguity. I have measured the same cabinets Art and Phil measured, and I've done it with a calibrated LMS system. I am telling everyone reading that the 1M measurements are nowhere close to the more distant measurements in scale. In fact, if you make a measurement with the microphone tip placed one meter from the cabinet face, the numbers are so far off you'll think the measurement system needs to go to the shop. But move back to a more appropriate distance and the numbers fall in line.
Hi Chaps,
To answer your question from Post #333, take a look at geitmans' SPUD thread, Post #84. There you'll find a properly done ground plane measurement setup. You can compare the result to other measurements earlier in that thread, e.g: Post #51 (mike in middle of mouth), as well as the original SPUD measurement (cannot find the original source, but I remember it being derived from a 10m/100W measurement) see Post #72.
Regards,
Measuring at a distance is a good idea no matter what speaker type you're working with. The whole point of measuring at a distance is to make the position accuracy required of the acoustic centers less important. Large distances reduce path-length/acoustic-center error because they scale the distances involved and make small errors insignificant.
I got that. But still wonders if a TH will measure more as a BR or a FLH, when measuring up close. As i understand, the iron law "begins" closer to a BR than a FLH, because of the pathlenght (or mouthsize?) .. It's kind of interesting, if you have people close to the speakers, as a BR probably will be louder than a FLH when you are close to it - as far as i understand. If it's due to the pathlenght of the FLH, i would like to know how a TH compares to that, since it also have the long path, but the actual speaker is right at the mouth.
Hope that makes sence, since i'm not that much into it
EDIT: Thanks for the tip Oliver, i will check that out!
Does this theory also apply for tapped horns as well? I mean, will a tapped horn measure more like a FLH or a BR, as you get closer to its mouth? I wonder since i'm trying to figure out if a BR will do better than my tapped when i do small parties/venues, where people are always really close to the stacks. If i get this right, a BR will sound louder than a FLH when close to it, and therefore have an advantage at that point?
I see I may have misread this earlier. My reply concerned itself mostly with accurate measurements:
"Measuring at a distance is a good idea no matter what speaker type you're working with. The whole point of measuring at a distance is to make the position accuracy required of the acoustic centers less important. Large distances reduce path-length/acoustic-center error because they scale the distances involved and make small errors insignificant."
This is true, but if I understand you right, you aren't so much concerned with measurements as you want a speaker that has an acoustic center shifted forward as much as possible, so it's loud close-up.
I'm not sure how to answer that, because so much comes into play. It is generally understood that the acoustic center of a traditional horn is pretty close to the diaphragm from midband up, but at lower frequencies, close to cutoff, it tends to shift forward. The amount of the shift depends on the mouth size, whether or not it is acoustically large or small. It doesn't shift all the way up to the mouth/face though, unless the horn is severely compromised (i.e. pipe, not horn). On the other hand, direct radiators usually have acoustic centers behind the face too. It's not usually as far back though. I'm not sure on tapped horns, but I would expect them to change depending on mouth size something like the traditional horns. Then again, with the woofer so close to the mouth, they may act more like direct radiators.
I would make this suggestion though: Don't get too caught up in trying to find a speaker that has a forward-shifted acoustic center. It makes a big difference one meter away, but less so three meters away and almost nothing ten meters away. I can't imagine any venue that will have people seated less than three meters away. Even home hifi environments are usually on this scale. By the time you get to this distance, the falloff is starting to normalize. And the things that shift acoustic center forward also tend to make the speaker less efficient, so it's not a trade-off I think you would want to make. If SPL is the goal, I would prefer a high efficiency speaker with acoustic center that is three meters back to a low efficiency speaker with forward-shifted acoustic center. It is just more useful.
Thanks a lot, that was exactly the kind if answer i was looking for.
But i actually often has people dancing right in front of the speakers, so think that it may make a difference if the acoustic center is far back og closer to the mouth.
Guess there is only one way to find out, since i just got som BR boxes on hand. Have to set up both the TH and the BR and see (hear) for myself whats happening close to them
But i actually often has people dancing right in front of the speakers, so think that it may make a difference if the acoustic center is far back og closer to the mouth.
Sure, but if you depend on the extra few decibels in the close-up "bubble" of a speaker with forward-shifted acoustic center, then everyone behind that will hear less bass. You have to equalize for one position or the other. I think that unless the dance floor is really small, probably you'll want to equalize for the far field and live with spectral imbalance in the near field. It's a classic problem, like power alley and many other placement anomalies. I think the goal is unform coverage over as wide an area as possible.
- Status
- This old topic is closed. If you want to reopen this topic, contact a moderator using the "Report Post" button.
- Home
- Loudspeakers
- Subwoofers
- Wayne's 12Pi sub