Hi All
I'm as usual at a bit of a loss on understanding the RIAA curve.
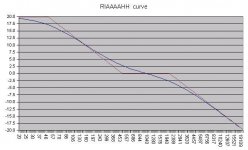
I have seen the RIAA curve and a 'staight line' curve underneath it. The straight line curve shows 0dB between 500 and 2122hz.
Currently on all our diy stages we are approx 2.5dB down at 2122hz.
Can anyone here explain why we only approximate the curve?
Rob
I'm as usual at a bit of a loss on understanding the RIAA curve.
I have seen the RIAA curve and a 'staight line' curve underneath it. The straight line curve shows 0dB between 500 and 2122hz.
Currently on all our diy stages we are approx 2.5dB down at 2122hz.
Can anyone here explain why we only approximate the curve?
Rob
Attachments
Hi,
The straight line version shows the 1st order time constants as "perfect"
1st order filters, no effect until the filter point, then immediate 6dB rolloff.
Its a typical method of showing the application for filters, but not the reality.
The straightline graph makes the 3 filter frequency points very explicit,
it also makes the intended gain variations of +/- 20dB (x10) explicit.
(The various low bass points or constants are not shown in the above.)
Real 1st order filters don't work like that at all, in the actual recording or playback.
As long as all your time constants are correct, the real RIAA playback is exactly
the inverse of the real RIAA equalisation applied to the vinyl recording +/- a bit.
The curve is also relative, real phono stages have around 40dB gain at 1kHz.
Try playing with the free TinaTi emulator and some simple RIAA circuits.
rgds, sreten.
SPICE-Based Analog Simulation Program - TINA-TI - TI Tool Folder
e.g. : http://sound.westhost.com/project91.htm
Last edited:
- Status
- This old topic is closed. If you want to reopen this topic, contact a moderator using the "Report Post" button.