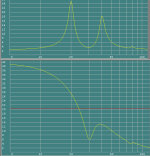
Correct. If I may, this is the actual impedance measurement of a ported enclosure of mine:
As you can see, there are three zero-phase points, but only one represents the tuned frequency--the one that corresponds with the local minima right in between the two impedance peaks, as you said.
Ooh, look, your impedance peaks are not the same height - the lower impedance peak is lower than the upper one. That means your alignment is "non-traditional" too (GD&R!).
Ooh, look, your impedance peaks are not the same height - the lower impedance peak is lower than the upper one. That means your alignment is "non-traditional" too (GD&R!).
Grrrr!! Oh great(!). What are we gonna do now to survive this catastrophe of astronomical, galactic proportions!?!

you have got to be KIDDING!!!!
Golly gee, I wish I could duplicate the emotion and bad phlegm of Oscar.
The impedance curve, as I've been saying, really does relate to the motion of the woofer cone. And the two-peak curve really is like the cone motion. Thanks to the anti-resonance at the point between the two peaks, the cone motion is minimal (although it is anybody's guess what the sound output is at that point).
But, as I said before, the impedance curve doesn't necessarily relate to the sound output of the speaker box. And to my taste, trafficking in resonances just ain't HiFi.
Oscar seems very heated and even abusive in his post. I wonder if there isn't some inverse relation between heat and light?
Ben
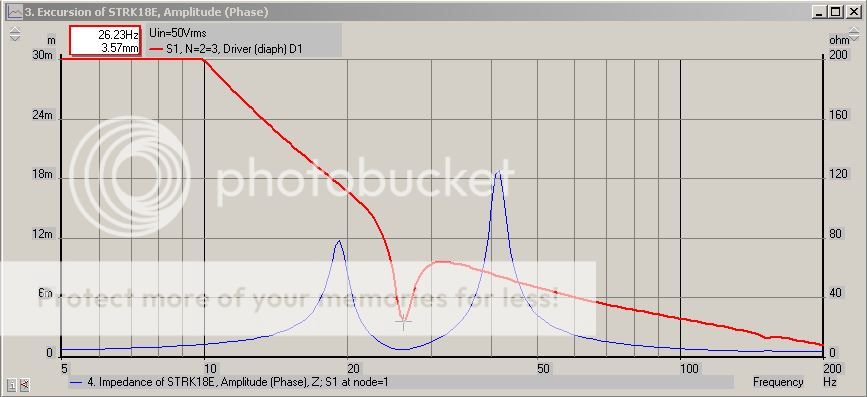
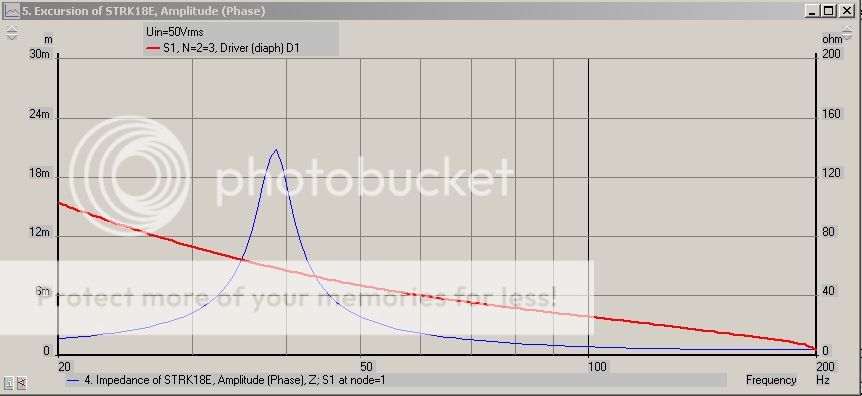
then explain the two HR pictures that Brian posted up. The excursion for a sealed enclosure increases as you go down in frequency. The impedance graph of said system, scaled any which way, up or down, will never resemble the cone excursion plot. The same goes with the excursion plot of a vented system---going down the frequency ladder, once you're below the tuning, the cone excursion escalates uncontrolled and skyrockets---yet in the impedance graph the impedance drops after the lower peak.
I'm sorry, but I'm with Brian on this one. It is just simply wrong to think that the impedance graph (outside of the fact that the impedance minimum relates to the cone's minimum excursion due to port damping) is directly proportional cone excursion.
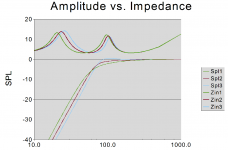
Here are two examples for even easier viewing, Impedance overlayed with excursion for both sealed and ported.
I'm sorry, but I'm with Brian on this one. It is just simply wrong to think that the impedance graph (outside of the fact that the impedance minimum relates to the cone's minimum excursion due to port damping) is directly proportional cone excursion.
Here are two examples for even easier viewing, Impedance overlayed with excursion for both sealed and ported.
Last edited:
The thing that measures like "impedance" of the voice coil has two elements: kind of static aspects (DC resistance, coil Henries) and "back EMF" arising from the motion of the cone. No kidding, when the cone moves, the back EMF pumps.
In the camel-shaped part of the BR impedance curve, the cone is really moving because that is its resonance range, except as poisoned by the anti-resonance of the box at the tuned frequency. Below, the cone is also moving because it has nothing additional to the suspension to hold it back. So it moves more. And the impedance curve, contrary to your ardent assertion, also is elevated in a related way.
To return to another hotly presented point of Brian Steele's, in sealed boxes, you sure do have a modest impedance peak at resonance, unlike Brian's absolute certainty there is no such thing. Unlike the BR resonant box, below that point, the cone motion is held back by the "acoustic spring" of the sealed interior. Which makes for a lot more Hi in the HiFi.
There is no need to apologize for your earlier abuse unless you are a courteous person.
Ben
Last edited:
And the impedance curve, contrary to your ardent assertion, also is elevated in a related way.
Go ahead and take that image(s) I posted, and show me, by drawing an arrow, a circle, or something, that indicates how the impedance rises in the same "related way" as cone excursion.
No need to apologize, as I wasn't being abusive---that was my 5000grit side. Abusive would be if my abrasiveness dips down below say, 50.
But, as I said before, the impedance curve doesn't necessarily relate to the sound output of the speaker box. And to my taste, trafficking in resonances just ain't HiFi.
Hmm... apparently your version of "HiFi" doesn't involve the use of speakers.
Go ahead and take that image(s) I posted, and show me, by drawing an arrow, a circle, or something, that indicates how the impedance rises in the same "related way" as cone excursion.
Yup, I would like to see that as well.
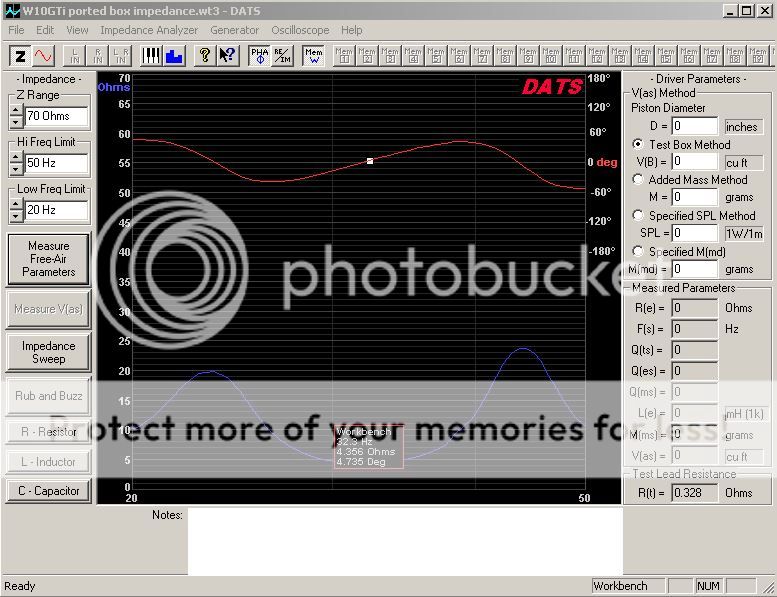
Correct. If I may, this is the actual impedance measurement of a ported enclosure of mine:
As you can see, there are three zero-phase points, but only one represents the tuned frequency--the one that corresponds with the local minima right in between the two impedance peaks, as you said.
Yes and you can divide the impedance value by 2 at the 60deg mark as far as the amp is concerned ..
The thing that measures like "impedance" of the voice coil has two elements: kind of static aspects (DC resistance, coil Henries) and "back EMF" arising from the motion of the cone. No kidding, when the cone moves, the back EMF pumps.
In the camel-shaped part of the BR impedance curve, the cone is really moving because that is its resonance range, except as poisoned by the anti-resonance of the box at the tuned frequency. Below, the cone is also moving because it has nothing additional to the suspension to hold it back. So it moves more. And the impedance curve, contrary to your ardent assertion, also is elevated in a related way.
To return to another hotly presented point of Brian Steele's, in sealed boxes, you sure do have a modest impedance peak at resonance, unlike Brian's absolute certainty there is no such thing. Unlike the BR resonant box, below that point, the cone motion is held back by the "acoustic spring" of the sealed interior. Which makes for a lot more Hi in the HiFi.
There is no need to apologize for your earlier abuse unless you are a courteous person.
Ben
That spring adds mass and you know what mass does to the hi in hi-fi .....
You are mistaken.
You guys need to calm down - impedance is proportional to cone velocity, which indeed has a single peak for sealed systems and a double peak for vented systems...
You guys need to calm down - impedance is proportional to cone velocity, which indeed has a single peak for sealed systems and a double peak for vented systems...
THANK YOU!
B.
@ OscarS
Hi, Your IB graph only goes down to 20Hz, whereas your BR one is 5Hz ! Could you show the IB down to 5Hz for a better direct comparison
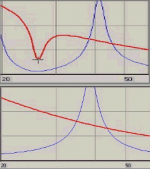
I've included a screenie of a BR Imp & Ex graph of one of my designs.
Generally it does "appear" that there "seems" to be an indirect correlation between Imp & Ex. Not Linear or Log, but as the Imp gets lower, the Ex does go up !
Hi, Your IB graph only goes down to 20Hz, whereas your BR one is 5Hz ! Could you show the IB down to 5Hz for a better direct comparison
I've included a screenie of a BR Imp & Ex graph of one of my designs.
Generally it does "appear" that there "seems" to be an indirect correlation between Imp & Ex. Not Linear or Log, but as the Imp gets lower, the Ex does go up !
Attachments
You guys need to calm down - impedance is proportional to cone velocity, which indeed has a single peak for sealed systems and a double peak for vented systems...
LOL - cone velocity is not the same as cone displacement.
@ OscarS
Hi, Your IB graph only goes down to 20Hz, whereas your BR one is 5Hz ! Could you show the IB down to 5Hz for a better direct comparison
Trust me, it won't matter. If you have done enough simulations, you [or rather I] already know what happens.
Generally it does "appear" that there "seems" to be an indirect correlation between Imp & Ex. Not Linear or Log, but as the Imp gets lower, the Ex does go up !
that is exactly what Brian was telling you in the first place, IE: The cone excursion of the driver does not follow the what the impedance is doing, with respect to increasing/decreasing behavior! It cannot. Neither can one extract the cone excursion plot solely from the impedance plot, and vice versa.
BTW, that is not an IB enclosure I posted. It is a sealed enclosure with a VB= approx 1-2/3 times the Vas of the speaker.
Shorter or longer?Are you sure you've got that the correct way around? I think shortening the ports should actually decrease the height upper impedance peak.
I am not sure. It was more than 15years ago.
But I am certain the lower frequency peak ended up lower than the higher frequency peak.
I used Bullock on Boxes as my guide to understanding what was happening within the box.
Shorter or longer?
I am not sure. It was more than 15years ago.
But I am certain the lower frequency peak ended up lower than the higher frequency peak.
I used Bullock on Boxes as my guide to understanding what was happening within the box.
AndrewT, Does the book explain this?
AndrewT, Does the book explain this?
The heights of the peaks are related to tuning frequency, but they are also strongly affected by box, port and leakage losses which are not simple to measure.
Port losses reduce the height of the lower peak as they are increased
box losses reduce the height of the upper peak as they are increased,
leakage losses reduce the height of both peaks (and raise the central minimum) as they are increased.
Last edited:
Here is a pic of a woofer with three different tunings with the same losses in each box. As you increase tuning frequency, the lower peak becomes higher because the woofer is freer to move at low frequencies. The upper peak becomes lower because the driver moves less there.
The relative heights of the peaks depends on Qts. For very low q woofers (where tuning is above resonance) generally the upper peak will be lower, and for very high q woofers (where tuning is below resonance) it will tend to be higher. The break point is around Q=0.4, where typical tunings will be near the free air resonance. The peak heights do not necessarily need to be equal for proper tuning, because they are also affected by losses as I stated in my earlier mail.
The relative heights of the peaks depends on Qts. For very low q woofers (where tuning is above resonance) generally the upper peak will be lower, and for very high q woofers (where tuning is below resonance) it will tend to be higher. The break point is around Q=0.4, where typical tunings will be near the free air resonance. The peak heights do not necessarily need to be equal for proper tuning, because they are also affected by losses as I stated in my earlier mail.
Attachments
The impedance curve (which, I hope everybody now understands, reflects the motion of the cone) is the only reliable way (short of an anechoic chamber) to really know how your BR construction is working.
The traditional goal is produce two equal camel-humps of impedance because that is the traditional intention regarding control of cone motion (in other words, the enclosure resonance precisely poisons the driver-in-the-box resonance). In practice, you stuff your parameters into the model and hope your construction works as per the model. If it doesn't, there are fixes but they aren't pretty.
None of this relates closely to sound output in the case of the BR because the upper bump is a place where the box ADDS to the sound and the lower bump where it subtracts (go figure...). But sound output performance in your listening room is not a simple thing to measure at low frequencies at the best of times with the best of equipment. So keep your eye on the impedance curve and it you don't like what you get, you shouldn't have so much faith in models*.
Ben
*as far as I'm concerned, there's no model that is especially useful for building sealed enclosures. Bigger is better and you choose the trade-offs.
Last edited:
- Status
- This old topic is closed. If you want to reopen this topic, contact a moderator using the "Report Post" button.
- Home
- Loudspeakers
- Subwoofers
- understanding Impedance graph.