Hans, thanks for your post.
I'm learning new things. I can look at the spectrum in ARTA (and Audacity) but I cannot do the processing per IEC 386. Anyway, thanks for the info. Good stuff

You could in Audacity via the Nyquist plug-in but it would take a skilled programmer to set it up for you.
Bill,As software can spit out both trivially I am not sure what the issue is. If you are tuning your system you want the full raw data to work from. If you want a number to compare to other numbers then run through the IEC as postprocessing. That way all are happy? Am I missing something?
On the other hand, this is after all a technical forum where details and backgrounds can be discussed to sharpen our minds.
I was particularly triggered by "time domain instantaneous shift."
That almost sounds as some still to be invented phenomenom, but I really can't get my fingers behind it.
Hans
Hans, A minor point, a minimum phase filter will decorrelate the wiggles from their position on the disk so the circular plots are no longer accurate position wise. I don't think the rms is affected by using linear phase filtering (power is conserved) but the peak to peak can possibly be.
Lost in the industry standard one number specs are things like the 9Hz poorly centered pulley or the 25Hz Lenco motor artifact, etc.
Lost in the industry standard one number specs are things like the 9Hz poorly centered pulley or the 25Hz Lenco motor artifact, etc.
It's just lazy explanation on my part.........I was particularly triggered by "time domain instantaneous shift."
Many aspects of vinyl playback mechanics make far more sense considered in the time domain, including variation of pitch. From moment to moment how pitch changes is pretty much how we perceive it in audible terms.
Of course, even 'instantaneous frequency' strictly has no physical meaning in the limit. But we all know what we mean in the context of a 3150Hz tone and a rotating platter in terms of pitch shift.
LD

ahh OK. Thanks LD.No, headshell position affects linear speed of the stylus relative to platter. Headshell displacement from nominal position directly affects pitch because stylus pivot is fixed, and so the stylus must scrub.
LD
A lower center of gravity at the headshell area so as most of the mass is as much in horizontal plane of stylus pivot as possible would help. isn't it ?
Regards
Part 1 of 4
I felt some urge to dig into the question: what useful information carries the signal that modulates the content of an LP, let’s call this signal Vmod,and does IEC386 bring us any further ?
For this purpose a single frequency around ca. 3 Khz was used and Vmod was extracted through careful FM demodulation.
Using an FFT seemed to be the appropriate way for analysing Vmod, the more detail, the better.
Since one of the frequencies to be expected is (1/1.8) Hz, caused at 33 1/3 rpm from a non-centric hole in the LP and from a possible eccentric spindleof the TT, this frequency should fall straight into one single frequency bin.
But since harmonics of this base frequency, hereafter called H1, are also to be expected, frequency bins should be small enough enabling to seeing the individual harmonics well separated.
That’s why was chosen for analysing 3 full LP revolutions,or a 5.4 seconds time window, resulting in frequency bins of 1/3*H1, giving a distance of three bins between harmonics.
Also was chosen not to use a window function, such as the often used Hann Window, because the effect of this will be a widening of the main lobe, thereby losing in frequency resolution.
The advantage of windowing, being that the side lobes are showing more detail deep down, is not of any advantage in this situation.
I used three different .wav files found in this thread, resp: 12.wav, 20171221-T001.wav and MK3wFpu1.wav. To this I added one of myself, 3150-401.wav.
Only the first recording was a bit too short with just 4 seconds to investigate over a full 3 LP revolutions, so the file was “zerostuffed” to 5.4 seconds to get the wanted FFT resolution.
Doing 3 LP revolutions, also enables displaying Vmod over 3 successive revolutions instead of the 2 displayed so far in circular and linear graphs,giving even a bit more insight in the correlation between the individual revolutions.
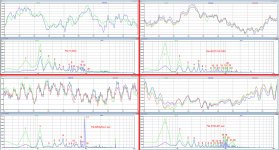
The FFT’s from Vmod, extracted from these 4 .wav files , the result from completely different recordings, taken from different LP’s with different Cart’s, Arms andTT’s are combined in the image below.
The green line in the 4 spectra shows the FFT of Vmod and the blue line the IEC386 weighted spectra.
All spectra have in common that almost all information being revealed are harmonics of H1, stemming from the rotational speed of the TT at 33 1/3 rpm.
The red numbers inthe spectra do correspond to the relevant harmonic, so 12 means the 12thharmonic or H12.
On one hand I was not expecting these harmonics at all, why they are there in the first place ?
I was at least expecting signs indicating Fres of Cart/Arm, motor sounds orwhatever, but so far I fail to see such details.
I felt some urge to dig into the question: what useful information carries the signal that modulates the content of an LP, let’s call this signal Vmod,and does IEC386 bring us any further ?
For this purpose a single frequency around ca. 3 Khz was used and Vmod was extracted through careful FM demodulation.
Using an FFT seemed to be the appropriate way for analysing Vmod, the more detail, the better.
Since one of the frequencies to be expected is (1/1.8) Hz, caused at 33 1/3 rpm from a non-centric hole in the LP and from a possible eccentric spindleof the TT, this frequency should fall straight into one single frequency bin.
But since harmonics of this base frequency, hereafter called H1, are also to be expected, frequency bins should be small enough enabling to seeing the individual harmonics well separated.
That’s why was chosen for analysing 3 full LP revolutions,or a 5.4 seconds time window, resulting in frequency bins of 1/3*H1, giving a distance of three bins between harmonics.
Also was chosen not to use a window function, such as the often used Hann Window, because the effect of this will be a widening of the main lobe, thereby losing in frequency resolution.
The advantage of windowing, being that the side lobes are showing more detail deep down, is not of any advantage in this situation.
I used three different .wav files found in this thread, resp: 12.wav, 20171221-T001.wav and MK3wFpu1.wav. To this I added one of myself, 3150-401.wav.
Only the first recording was a bit too short with just 4 seconds to investigate over a full 3 LP revolutions, so the file was “zerostuffed” to 5.4 seconds to get the wanted FFT resolution.
Doing 3 LP revolutions, also enables displaying Vmod over 3 successive revolutions instead of the 2 displayed so far in circular and linear graphs,giving even a bit more insight in the correlation between the individual revolutions.
The FFT’s from Vmod, extracted from these 4 .wav files , the result from completely different recordings, taken from different LP’s with different Cart’s, Arms andTT’s are combined in the image below.
The green line in the 4 spectra shows the FFT of Vmod and the blue line the IEC386 weighted spectra.
All spectra have in common that almost all information being revealed are harmonics of H1, stemming from the rotational speed of the TT at 33 1/3 rpm.
The red numbers inthe spectra do correspond to the relevant harmonic, so 12 means the 12thharmonic or H12.
On one hand I was not expecting these harmonics at all, why they are there in the first place ?
I was at least expecting signs indicating Fres of Cart/Arm, motor sounds orwhatever, but so far I fail to see such details.
Attachments
Last edited:
Part 2 of 4
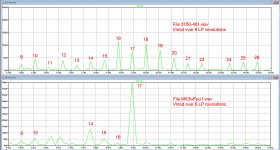
Being shocked by this outcome, I went one step further and took again the FFT from Vmod extracted this time from 6 revolutions of 3150-401.wav, to have an even finer resolution in the frequency domain, see the upper part of the figure below.
But the FFT, here showing the frequencies from 4,5 to 15 Hz,left no doubt.
Again all frequencies popping up are harmonics from H1.
In my case, using a 250 rpm motor at 50 Hz mains, I could have seen a peak at 5 Hz and harmonics at multiples of 5Hz but not at distances of H1.
But I can hardly see anything at 5 Hz that stands out, so is my motor causing trouble?
It doesn’t look that way.
So the motor does not seem to be the cause of all the multiples of H1, but what then?
I did the same exercise magnifying MK3wFpu1.wav, displayed in the lower part of the image below. E
ven though the peak at 9.4444 Hz initially looked like a possible Cart / Arm resonance it still turned out to be H17.
But at least with this file the small area between H10 and H14 showed some content that was not harmonics related, although not clear what it could be.
Had this to do with some Cart / Arm resonance, although at 6.5 Hz it is a bitlow in frequency to my feeling?
A warped LP will indeed cause higher harmonics of H1 to be produced, but so many as here?
Why and how could that be ??
And in my case, I’m using a peripheral ring, firmly holding the LP flat to the Platter resulting in absolutely no visible signs of warp.
So warp seems unlikely to be the cause of the vast amounts of harmonics.
And what about Fres from the combination Cart / Arm ?
Since Fres lies at approx. 10Hz, I would expect to see something around this frequency, not being a multiple of H1, but only MK2wFpu1 showed anything that could possibly be seen as such, but all others didn’t.
That brings me to the next point, the IEC 386 weighting to assess wow+flutter.
As previously mentioned, in all frequency plots the blue line shows the spectrum after IEC weighting.
But if almost all multiples of 0.5556 Hz are not caused by either motor or theCart / Arm combination, it will tell very little about the quality of the LP playing machine as such.
Unfortunately, I possess no other LP with a test tone. In that case I could have had the possibility to compare and see whether the cutting machine could have anything to do with the strange and unexpected outcome of my analysis.
A cutting machine that is driven by gears, could certainly transfer all the harmonics into the LP content.
Attachments
Part 3 of 4
But then, all at the sudden it crossed my mind that maybe some info was missing, making it impossible to make the right conclusions.
Most Riaa amps have some sort of fixed rumble filter filtering everything below15 Hz.
This filter could prevent seeing any resonance letting the signal as a whole “waving”up or down, not to be confused with amplitude modulation.
The question is now, does this vertical motion add anything to Vmod ?
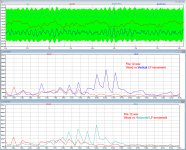
Therefore I made a graph with the incoming signal 12.wav in green, together with its vert. LF filtered content L-R in blue, the hor.
LF movement L+R in cyan and added Vmod in red, all together after some level shifting and magnifying for better visibility.
See upper part of the image below.
Visible are Fres hor and Fres vert, both a bit different infrequency, resp. ca 9.5 Hz and 10.6 Hz, but both of the same order of amplitude or the same Q.
And although the waving was small because of some sort of (rumble)filter that had been used, some waving was still there.
Displayed below are the spectra of Vmod vs the Vert. LF (L-R) and Vmod vs the Hor. LF (L+R) movementof the Cart.
In this case there is not much correlation between any of both and Vmod.
Maybe some additional filtering had beenapplied to the LP signal, masking the effects of waving and making further analysis impossible ?
On the other hand, although vertical and horizontal resonance is clearly visible, in the FFT’s the resonance is divided over several frequency bins, with the exact distance of H1 between them.
This can only mean that both Fres hor. and Fres vert. are FM modulated by H1 up to H6 !
This is at least one step in the direction of understanding why all peaks in the FS are multiples of H1.
But then, all at the sudden it crossed my mind that maybe some info was missing, making it impossible to make the right conclusions.
Most Riaa amps have some sort of fixed rumble filter filtering everything below15 Hz.
This filter could prevent seeing any resonance letting the signal as a whole “waving”up or down, not to be confused with amplitude modulation.
The question is now, does this vertical motion add anything to Vmod ?
Therefore I made a graph with the incoming signal 12.wav in green, together with its vert. LF filtered content L-R in blue, the hor.
LF movement L+R in cyan and added Vmod in red, all together after some level shifting and magnifying for better visibility.
See upper part of the image below.
Visible are Fres hor and Fres vert, both a bit different infrequency, resp. ca 9.5 Hz and 10.6 Hz, but both of the same order of amplitude or the same Q.
And although the waving was small because of some sort of (rumble)filter that had been used, some waving was still there.
Displayed below are the spectra of Vmod vs the Vert. LF (L-R) and Vmod vs the Hor. LF (L+R) movementof the Cart.
In this case there is not much correlation between any of both and Vmod.
Maybe some additional filtering had beenapplied to the LP signal, masking the effects of waving and making further analysis impossible ?
On the other hand, although vertical and horizontal resonance is clearly visible, in the FFT’s the resonance is divided over several frequency bins, with the exact distance of H1 between them.
This can only mean that both Fres hor. and Fres vert. are FM modulated by H1 up to H6 !
This is at least one step in the direction of understanding why all peaks in the FS are multiples of H1.
Attachments
Part 4
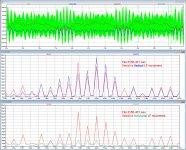
I own a Riaa preamp having –3dB@0.7Hz, allowing to make this “waving” of the signal very visible.
I followed the same procedure and extracted the hor. and vert. LF information from the file 3150-401.wav.
Again the incoming signal in green, vert. LF in blue, Vmod in red and hor. LF in cyan were all brought together, where all signals are level shifted and properly magnified.
See image below.
In this case a few things are immediately obvious. The vertical resonance at ca 9.7 Hz is 5 times as large as its horizontal counterpart at ca 10 Hz.
And a strong correlation between the waving caused by the vert. resonance and Vmod is already quite visible.
When taking the FFT from the normalised vertical movement and from Vmod, it becomes crystal clear that almost all content beween 4,5Hz and 15 Hz is most likely caused by this vertical movement of the Cart.
Be aware that this FM modulation has already taken place before the signal enters the Riaa preamp, so using a rumble or any other type of filter cannot prevent this FM modulation from happening.
As expected, because of the much lower amplitude, the correlation between the hor. LF movement and Vmod is not so obvious.
This is at least one step in the direction of explaining where these frequency components came from and should be seen it in this case as a TT related issue.
Some sort of damping in the vertical plane could most likely improve things quite a bit.
However keep also in mind the level of this FM modulation. The most prominent peaks at H16 and H18 are at resp. 110uV and 100uV, each corresponding to 0.01% FMmodulation, way below the auditory threshold.
Adding those individual components is complex but has to be done at best by taking the sqrt of the sum of the squares.
The files MK3wFpu1.wav and 20171221-T001 were both recorded in mono, so valuable vertical info was missing and they brought little additional info because of that.
To conclude:
1) Quite obvious is that the lower harmonics H1 to H6 are from eccentricity and from warped records. In this part of the spectrum, up to 3Hz, IEC386 has no business to do and more or less excludes this part of the spectrum by means of their weighting filter.
2) From thereon, 4 Hz and higher there is a first indication that this might have to do with resonance of Cart / Arm.
In just one case, peaks in the FS of Vmod could be correlated to the vertical resonance in the input signal from the Riaa preamp.
In this specific case, IEC386weighting could indeed reveal some of the TT’s properties with valuable info.
Other stereo .wavfiles made available, straight from the Riaa preamp, with very little rumble filtering could help to start further investigation on correlation between LFresonance and spectral lines between 4.5and 15 Hz.
After all, one swallow doesn't make a summer.
Hans
Attachments
I did the same exercise magnifying MK3wFpu1.wav, displayed in the lower part of the image below. E[/SIZE][/FONT]
ven though the peak at 9.4444 Hz initially looked like a possible Cart / Arm resonance it still turned out to be H17.
But at least with this file the small area between H10 and H14 showed some content that was not harmonics related, although not clear what it could be.
Had this to do with some Cart / Arm resonance, although at 6.5 Hz it is a bitlow in frequency to my feeling?
As I've stated previously, this is NOT a recording of a test record. It is a recoding of the internal frequency generator of the motor, and a flawed one at that as the signal acquisition method caused instability in the loop. Forget this file exists.
None of my files have RIAA de-emphysis.
Last edited:
Thanks JP, I obviously overlooked that statement.As I've stated previously, this is NOT a recording of a test record. It is a recoding of the internal frequency generator of the motor, and a flawed one at that as the signal acquisition method caused instability in the loop. Forget this file exists.
None of my files have RIAA de-emphysis.
At least one inexplicable peak at 9.444Hz is solved.
Hans
Last edited:
JP,.
None of my files have RIAA de-emphysis.
Just to be sure I understand you correctly.
Does the file 20171221-T001 have the Riaa correction or not ?
Hans
Initially I jumped into this thread after #70, but last weekend I finally found the time to read the whole thread and found out that I missed quite a lot of what was going on.
- Bill, somewhere in the beginning, you asked for a .wav file of my TT.
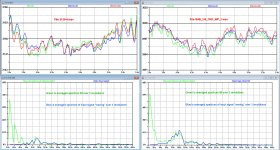
Below is an image combining JP’s file GAE_XG_7001_WF_1.wav , for a DD TT, with my 3150-4.wav for a belt driven TT with linear tracker.
Both rather technically different versions, DD and Belt drive, are performing very good, keeping the IM products well under the critical threshold of 0.1% peak or in this case 3 Hz peak, even so more when excluding the 0.55 Hz from eccentricity.
Spectra are showing IM in rms value, so peak value for eccentricity (at 0.55Hz) is sqrt(2)times higher, or below 0.06% IM in both cases.
In the spectra of both, you see in blue the "waving" spectra of the incoming LP signal, caused by Cart resonance, obviously having a great contribution to the IM spectrum in the area above 6 Hz.
The used file 3150-4.wav is attached below, so if LD would be so kind, he could produce a circular version for comparison, because as it seems, this circular presentation is what most people prefer ? - Scott, I also missed because of my late start that you had spent quite some time improving your version of Analysing SW. Now I understand a bit better your reaction concerning this not being a contest.
But again, all my efforts are only to find out and suggest what should be displayed and for that I need some tool for support. - Dropbox - 3150-4.wav
Attachments
Last edited:
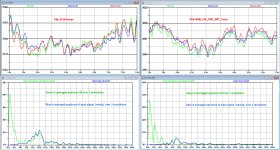
Yes of course, here it is, everything correctly lined up.Can you fix it to avoid confusion?
Hans
Attachments
Part 4
...
Some sort of damping in the vertical plane could most likely improve things quite a bit.
...
Hans
This can be very easily quantified. Run the test with a Shure M97xE, Type 4, or Type 5, first with the brush up and then again with the brush down, in the same arm and turntable. To be valid, the stylus needs to be an OEM Shure. Brush damping on aftermarket styli are not assured to have the same damping characteristics as OEM original design.
Ray K
Last edited:
Of course the SME brush provides horizontal damping as well, just by a different mechanism. But this does open up an interesting area for investigation. Shure focussed on warp damping, but most of the commercial tonearm damping solutions only damp horizontally (SME, Townshend etc). Not sure how Jelco do it or the unipivots, but I think this is an area where research would be interesting as the cart resonance isn't just a vertical or a horizontal resonance but something existing at all angles. So you might think that damping in multple planes is required, but maybe damping one will supress the others enough for the task at hand.
Certainly worth some investigations!
Certainly worth some investigations!
- Status
- This old topic is closed. If you want to reopen this topic, contact a moderator using the "Report Post" button.
- Home
- Source & Line
- Analogue Source
- Turntable speed stabilty