
Interesting how clicks on the recording cause the PLL to flip, an edge triggered phase detector would be even more sensitive than the XOR
I forgot to ask LD what he does about clicks, some of the other tools I've seen show them up dramatically.
Nothing. That SW is remarkably tolerant of clicks, I think mostly because it is very tolerant of instantaneous amplitude of the carrier and a few missing cycles within a frame just depresses amplitude, so long as the click is broad spectrum and hasn't got much content near the f of interest. Which seems to be the case.I forgot to ask LD what he does about clicks, some of the other tools I've seen show them up dramatically.
LD
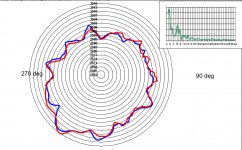
Thx Davidsrsb - here's a polar plot from my SW for that file which might be handy for checks or calibration.One I made with a STD305S and the HFS75 test record, 3 kHz tone
http://www.cix.co.uk/~dayojah/3khzhfs75.wav
I suspect rumble could mess up my method, as it phase modulates the zero crossings, which is why I band limit to the range 2kHz up to 4.5kHz
Zero crossing detectors - I doubt can have required accuracy or noise rejection as you say.......
HTH !
LD
Attachments
A further comment about clicks:
Clicks contribute to the FM spectrum, ie pitch variation, due to headshell displacement. Which settles in a classic log-dec pattern at the natural cart-arm frequency in a time determined by damping.
So that is what one should see on a polar plot in response to a click event, or a patch of high stylus-groove friction - a pitch excursion followed by a log-dec type settle time.
LD
Hmm, a high level of FM and fairly low frequency too.Thx Davidsrsb - here's a polar plot from my SW for that file which might be handy for checks or calibration.
LD
The STD has an unusual AC synchronous motor, not the usual one on Linns etc. It has a different number of poles.
This is not the original motor, which failed under warranty. I noticed the replacement was different.
I am experimenting with a hardware engineers approach. I have made a LTSpiceXVIII simulation of a 3kHz centre PLL and use the test record 3kHz wav file as input. The demodulated output is looking good.
I can save that to a file and make a polar plot.
Using Audacity to cleanup the wav file first with a 2kHz 24dB HPF and 5kHz 24dB LPF makes the input wav look a lot cleaner
I have been attempting to run the sim but it will not get further than a few uSecs even if I leave it to run for several hours. I have tried it out on two computers with the same results. Anyone else had a similar issue (and know's of a fix!?). I'm not experienced enough with LTSpice to alter any of its setting if this is what is required.
Regards,
I think mostly because it is very tolerant of instantaneous amplitude of the carrier and a few missing cycles within a frame just depresses amplitude, so long as the click is broad spectrum and hasn't got much content near the f of interest. Which seems to be the case.
LD
Hint
") I just checked that the basic Anaconda Python install includes everything needed from the signal processing toolbox so I can run the Matlab script for the standard Hilbert transform method of instantaneous frequency on this file. The problem still tweaks my curiosity.
I just checked that the basic Anaconda Python install includes everything needed from the signal processing toolbox so I can run the Matlab script for the standard Hilbert transform method of instantaneous frequency on this file. The problem still tweaks my curiosity.I am using default settingsThe simulator is probably reducing the timesteps to maintain the specified tolerances.
LTSpiceXVII(x64) August 16 2017
Yes - I suspect you might find it lacks necessary accuracy/ noise rejection, but I'd be interested in the outcome....... curiously, it's quite a demanding application........I can run the Matlab script for the standard Hilbert transform method of instantaneous frequency on this file. The problem still tweaks my curiosity.
LD
I think one can look at such a plot and hopefully separate contributing elements, and tackle them.Hmm, a high level of FM and fairly low frequency too.
The STD has an unusual AC synchronous motor, not the usual one on Linns etc. It has a different number of poles.
This is not the original motor, which failed under warranty. I noticed the replacement was different.
There's quite a lot of once-per-platter-revolution stuff which mimics eccentricity: it could, of course, simply be record centring/eccentricity. Or vertical run out.....spindle vertical alignment.....or bearing drag...
Then the spectral content of what's left can be a useful clue as to its origins: for example number of motor poles determines cog repetition frequency in a synch motor, so one can deduce that. And cart/arm resonance(s) can be be prominent.
In this case, it looks like there are 2 or 3 contributing causes that might be tackled, but that's the upside of polar plots: at least one can know about the nature of what one is dealing with, and quantify its significance in the scheme of things.
HTH!
LD
I think a hardware meter would have averaging limitations.......I am thinking that it might be possible to make a real hardware meter for this using the PLL approach, useful for fault finding and motor waveform tuning
In hardware, one could make a heterodyne mixer so as to generate a tuneable difference frequency of a few hundred Hz, then listen to it in real time.........?
That would magnify audible pitch variations.
It's the time domain nature of analysis that allows one to diagnose the source of pitch variation; I think that's partly what polar plots bring to the party. An audible version might be interesting and straightforward in hardware ?
LD
Last edited:
What a HW solution might be interesting for it tracking eccentricity. Getting a visual indicator of eccentricity is tricky but a pitch shift would be potentially be much easier.
I need to play with colour wheels for locating the sector where the peak eccentricity is. There must be a way without the complexity of the Nakamichi solution!
I need to play with colour wheels for locating the sector where the peak eccentricity is. There must be a way without the complexity of the Nakamichi solution!
- Status
- This old topic is closed. If you want to reopen this topic, contact a moderator using the "Report Post" button.
- Home
- Source & Line
- Analogue Source
- Turntable speed stabilty