This is the setup with which have done the tests that will follow.
This setup go considered for the absolute values of " Interface distortion" or " EMF distortion", but it has permitteded me to appraise the difference of harmonic envelop among the amplifiers, to parity of EMF solicitation.
Are able even notice the different behaviours to the vary of the topologies and of the "distribution" of NFB ( local or global ). Personally doesn't succeed to define this behaviours as a true THD and one's own. The systems of loudspeakers are resonant elements, and I prefer that the amplifier becomes integral part of the system, exactly as the crossover filters ( define the level of shading of the free oscillation but doesn't stop it ). It will be nonelementary to associate the "sonic" characteristics to the various forms of envelopment, but per hour are the only measures that give an exact and different imprint, one's own as the listenings.
PS: The "Q" of LC filter are very determinant. My setup is not a lot of efficient, because doesn't dispose of a high current choke.
Mauro
Attachments
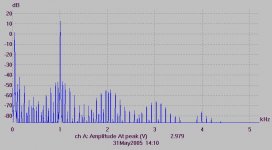
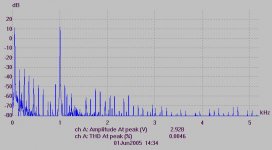
And My_Ref circuit @1W 8ohm + 1,4Vrms EMF...
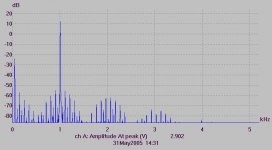
Naturally the ampleness of the harmonicas is able vary modifying the setup, and modifying the level of the fundamental, but not the harmonic envelopment.
Notice as the fundamental thing to 50 Hz they settle in on a level answerable to the factor dumping of every amplifier ( difference in dB among 1Khz and 50 Hz ).
Mauro
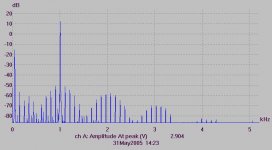
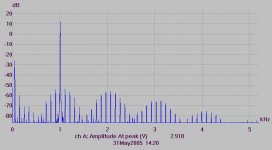
Attachments

Cavolo, Mauro, Complimenti!
These are extremely interesting tests! Thanks a lot for your efforts!
As Jan had said at a time: here there is food for thoughts!
What You say above here is exactly why I risked a guess that the amp Zout in the original fig. 3 - 2 is high - I don't know, the graphics quality is bad, but it seems to me that the original signal amplitude of the 50Hz [fig. 3 -1 ] and the one in 3-2 are equal - that is , zero dumping, that is, high output Z.
Hm, eventually we have a shortage of information here. In fact, there is some inconsistency in the graphs as Ingrast had already pointed out.
You tested Your ref. design, which contains the Howland current pump as output buffer, but, at the end ["complessivamente"], it still is a low Z out voltage amplifier. Could You, please, try also only your output buffer, as a high Zout transimpedance amp? I know that I am asking for some efforts, because You have to reconfigure..
Congratulazioni! George
These are extremely interesting tests! Thanks a lot for your efforts!
As Jan had said at a time: here there is food for thoughts!
Notice as the fundamental thing to 50 Hz they settle in on a level answerable to the factor dumping of every amplifier ( difference in dB among 1Khz and 50 Hz ).
What You say above here is exactly why I risked a guess that the amp Zout in the original fig. 3 - 2 is high - I don't know, the graphics quality is bad, but it seems to me that the original signal amplitude of the 50Hz [fig. 3 -1 ] and the one in 3-2 are equal - that is , zero dumping, that is, high output Z.
Hm, eventually we have a shortage of information here. In fact, there is some inconsistency in the graphs as Ingrast had already pointed out.
You tested Your ref. design, which contains the Howland current pump as output buffer, but, at the end ["complessivamente"], it still is a low Z out voltage amplifier. Could You, please, try also only your output buffer, as a high Zout transimpedance amp? I know that I am asking for some efforts, because You have to reconfigure..
Congratulazioni! George
Joseph K said:[snip]But, I would like to note, that not only the figure 3- 2 diagram can be reproduced by a high output Z device, but also it CAN NOT BE reproduced by a low output Z device [ we would see only 1kHz]!
For me it's quite a proof that he used some kind of current generator.
Ciao, George
George,
Did you mean the amp or the test generator (50Hz)?
Jan Didden
Jan!
I meant the amp, definitely. I suppose the test generator was set up like Mauro had done: by a transformer from the line voltage. Now, if the DUT would have had a low Z out, then, in the same way as it is visible in the tests of Mauro, the injected 50 Hz test signal should have been attenuated. As far as I have seen, from diagram 3-1 to 3- 2 it is not. But then, these diags are strange: the other ones have a different scale? [3 -3; 3-4; 3-5] Why is it, that the test 50Hz tone in them appears to be much higher?
Then, unfortunately it is a bit of confusion, generating the test signal from the power supply line: it's harmonics are mixed with power artefacts...
Ciao, George
Some comparisons:
the amplitude of the 50 Hz that have used for for the tests to 1W is of 2, 5Vrms ( +10 dB about ) and not 1, 4Vrms as have written to make a mistake.
This measures are a lot of approximate, and the only "constant" that has noticed varying the setup are the general envelopment.
How to say George, the "Barbarian" setup that is using produces a lot of harmonicas ( 50Hz power line ) that are able create problems of analysis. I have used this technique to eliminate to the base the doubts on the influence of the dumping of the amplifier to 50Hz, but from the data that I have stood out it may use an ordinary amplifier + a sine generator 50Hz -90 dB.
You will forgive me if in the hurry it exposes things don't cut off or don't verify.
For what concerns the Hiraga graph, I have not references of scale factors and have not reproduced perfectly her setup, for which have not elements to reason.
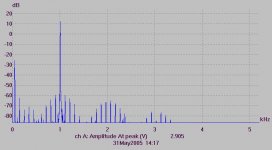
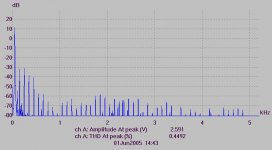
I attach the measure of the signal to 50Hz and that of the current pump by himself ( MY_ref output only ): How to be seen, the high impedance of the bridge doesn't damp from it the signal to 50 Hz from it his harmonicas, for which is not distinguished that produced from the amplifier from that produced from the 50Hz gen.
Virtually, a current generator to high Zout is exempt from the EMF ( the problem is adapt it to the changes of impedance of the loudspeakers!).
Obviously to show it be necessary it improve is the performances of the bridge that of the setup of measure, but per hour I has exhausted my time.
the amplitude of the 50 Hz that have used for for the tests to 1W is of 2, 5Vrms ( +10 dB about ) and not 1, 4Vrms as have written to make a mistake.
This measures are a lot of approximate, and the only "constant" that has noticed varying the setup are the general envelopment.
How to say George, the "Barbarian" setup that is using produces a lot of harmonicas ( 50Hz power line ) that are able create problems of analysis. I have used this technique to eliminate to the base the doubts on the influence of the dumping of the amplifier to 50Hz, but from the data that I have stood out it may use an ordinary amplifier + a sine generator 50Hz -90 dB.
You will forgive me if in the hurry it exposes things don't cut off or don't verify.
For what concerns the Hiraga graph, I have not references of scale factors and have not reproduced perfectly her setup, for which have not elements to reason.
I attach the measure of the signal to 50Hz and that of the current pump by himself ( MY_ref output only ): How to be seen, the high impedance of the bridge doesn't damp from it the signal to 50 Hz from it his harmonicas, for which is not distinguished that produced from the amplifier from that produced from the 50Hz gen.
Virtually, a current generator to high Zout is exempt from the EMF ( the problem is adapt it to the changes of impedance of the loudspeakers!).
Obviously to show it be necessary it improve is the performances of the bridge that of the setup of measure, but per hour I has exhausted my time.
Attachments
Dear Mauro,
E bellissimo! grazie tanto!
Really, thanks a lot for Your efforts, and I tip my hat in front of Your professionalism!
What I see in these last graphs is that yes, your test gen [50Hz] produces a lot of harmonics, and these make a bit difficult to evaluate, but! As it is visible & and confirmed by You, your high Zout output buffer does not add too much to the original test generator spectra. So, in this way behaves like the one in the fig 3 -2. I was comparing the last two graphs to and fro, and see a difference like the two [and not more] sidebands at around 1 kHz, two spuries at around 1.6 -1.8 kHz, and an increased hash down at -80 db, which is probably noise. I would say, that in case of a clean test signal like in the hiraga setup, this all would mean a clean spectra close to fig 3 -2.
On the other hand, it does not eliminate anything from the test gen spectra, that is, does not damp at all the loudspeaker, as it was to be expected.
When you include this High Zout output buffer in a feedback loop to provide a Low Zout voltage amplifier, it starts to fight with the loudspeaker trying to damp it, and starts to shape the original spectra, like all the other low impedance amps do it.
Now, You claim, rightfully, that this not damping the speaker is dubious.
And it is true. It is something with which everybody should experiment personally. I can only say that I was expecting something unlistenable, with my non-current-drive-optimized loudspeaker; and was very much surprised to get something more appealing then before! My friend with his SF Concerto-s also.
I don't say that everything became at once ideal. The bass response is dubious. From one side is much more appealing, from another point is underdamped. But this then starts to depend on the actual config, the speakers, the amount of PS capacitance - we found that with 1000 uF you can be quite lucky.. somehow counter-balancing the bass response..
And given the fact that with current drive you don't need any more to provide uncontrolled amounts of current, it's even possible to get away with small PS caps.
Excuse me for this long rant!
Ciao, George
E bellissimo! grazie tanto!
Really, thanks a lot for Your efforts, and I tip my hat in front of Your professionalism!
What I see in these last graphs is that yes, your test gen [50Hz] produces a lot of harmonics, and these make a bit difficult to evaluate, but! As it is visible & and confirmed by You, your high Zout output buffer does not add too much to the original test generator spectra. So, in this way behaves like the one in the fig 3 -2. I was comparing the last two graphs to and fro, and see a difference like the two [and not more] sidebands at around 1 kHz, two spuries at around 1.6 -1.8 kHz, and an increased hash down at -80 db, which is probably noise. I would say, that in case of a clean test signal like in the hiraga setup, this all would mean a clean spectra close to fig 3 -2.
On the other hand, it does not eliminate anything from the test gen spectra, that is, does not damp at all the loudspeaker, as it was to be expected.
When you include this High Zout output buffer in a feedback loop to provide a Low Zout voltage amplifier, it starts to fight with the loudspeaker trying to damp it, and starts to shape the original spectra, like all the other low impedance amps do it.
Now, You claim, rightfully, that this not damping the speaker is dubious.
And it is true. It is something with which everybody should experiment personally. I can only say that I was expecting something unlistenable, with my non-current-drive-optimized loudspeaker
I don't say that everything became at once ideal. The bass response is dubious. From one side is much more appealing, from another point is underdamped. But this then starts to depend on the actual config, the speakers, the amount of PS capacitance - we found that with 1000 uF you can be quite lucky.. somehow counter-balancing the bass response..
And given the fact that with current drive you don't need any more to provide uncontrolled amounts of current, it's even possible to get away with small PS caps.
Excuse me for this long rant!
Ciao, George
") )]
)]Joseph K said:....When you include this High Zout output buffer in a feedback loop to provide a Low Zout voltage amplifier....
I pointed out this in the
second page of the original thread, nominally the system as a whole behaves as voltage amplifier with a nominal gain a little over 30x.
In a perfect world output impedance should be (roughly) decreased as much as the outer open loop / closed loop gain ratio.
In the real world, frequency dependent behavior factors in making things worse than ideal and a bit more complex.
The bottom line is the actual implementation, taking into account the above caveat and actual amplifier - speaker combination, may result better than usual, but it cannot fairly be attributed solely to the output stage transconductance topology.
What is needed is just what Mauro is doing. A humble and dedicated effort to build and measure as objectively as practical what theory suggests.
Rodolfo
I have asked Mr Hiraga some information on the type of amps that gave these graphs. He promised to mail me something (snail mail) and I'll report when I get it. He did mention that some of the better amps were 'feedforward types like the Quad 405'. More next week, I think.
Jan Didden
Jan Didden
Hi, Mauro,
Thanks for your effort. It seems all results are like graph5, none like graph 2, 3 or 4.
Do the difference of the graphs shown in your measurement(s) shows something about how they sound differently in real music?
I assume graph 3 and 4 is reproduced by a high IM power amp.
But still about graph 2. Is it possible to get graph 2 (so clean reproduction) with any topology known here?
Graph2 is produced by Quad 405?
Thanks for your effort. It seems all results are like graph5, none like graph 2, 3 or 4.
Do the difference of the graphs shown in your measurement(s) shows something about how they sound differently in real music?
I assume graph 3 and 4 is reproduced by a high IM power amp.
But still about graph 2. Is it possible to get graph 2 (so clean reproduction) with any topology known here?
He did mention that some of the better amps were 'feedforward types like the Quad 405'.
Graph2 is produced by Quad 405?
lumanauw said:[snip]Graph2 is produced by Quad 405?
I don't know, I am waiting to receive some material from him. All he wrote in the email is what I quoted.
Jan Didden
This is one of my principal objectives. How to be obvious, the 4 amplifiers ( even have tried other ) have a different sound, but I am all to way they of the good amplifiers. To do a "empirical" chart that compares the graph to the sonic characteristics wants a great deal of time and a lot of rigor.Do the difference of the graphs shown in your measurement(s) shows something about how they sound differently in real music?
The thing that is able you say with extreme safety is that I have un amplifiers that have looked for of " clone to eavesdrop " changing topology, and with this graph the factor of form of the harmonics are incredibly similar ( then the ear seems tender to this parameters ). take too seriously the my first evaluations, is too ready...
I assume graph 3 and 4 is reproduced by a high IM power amp.
How to have read, there are a lot of perplexity concern the scale factor of this measures. We wait Jan to have more data.
For the years that have passed before to the FFT, this curves are typical of a very strong saturation. Not necessarily trade of IMD, imagines for example a output stadium of emitter follower with a not adeguate polarization; injecting a tide from the outside it may move the point of work of the BJT in non linear zone...
But still about graph 2. Is it possible to get graph 2 (so clean reproduction) with any topology known here?
I have written that an elevated immunity to the EMF it may get with various techniques. The first newses of Jan give me reason (FeedForward) but even other ways are usable.
The first problem, as you you did notice, it is reproduce the Hiraga test, given that I have reasoned more on the factor of form ( seen the interesting cue of analysis that is emersed ) that on the absolute value. How to have observed, I have reproduced the curve 5 ( attenuated ), but with a "enormous" 50Hz saturation ( 1:1,2 ) to underline well the differences to 1W ( and eliminate the problems of current limitation, diverged among every amplifier on a test ). In wait of other comparisons of Jan, I am able only say that with the second-hand relationship by Hiraga ( 1:31 = -30dB@50Hz ) all the amplifiers that I have make a won't underline THD ( to all the levels ). I have even the problem that the amplifiers that I have am objectively of good quality, for which doesn't succeed to reproduce the THD analyses from Hiraga. I have the feeling that the answered to your question is more simple: all the topologies( solid state ) well plan produce curve 2. Naturally I prefers show my theories with the test, and when I will have more data will confirm you if I am right or no.
Ciao
Mauro
Some year will do have decided to reproduce that sound with other techniques.
Using LM3886 in various configurations have arrived to My_ref. The sonic result is a lot of similar, and I felt me very satisfied, and in any characteristics (3D) I had nearly overcomed my reference.
When I have compared the graph am excited me! notices the simile of the envelopments and the minor harmonics dumping ( that associate to the greater 3D of the reference ). If you adds that D. Self "Load invariant" has an acoustic very similar imprint but with less 3D of the other...
Attachments
- Status
- This old topic is closed. If you want to reopen this topic, contact a moderator using the "Report Post" button.
- Home
- Amplifiers
- Solid State
- The many faces of distortion