I would be interested to know if the same effect happens if you set up the speakers in a different listening environment, e.g. differently shaped room and/or with a different amount of adsorbing material. My guess is that the room is reflecting some energy back to your listening position that generates a comb filtering type effect and this generates an ambience effect, giving the illusion that the soundfield is high.
Room response can be very, very influential on the sound of a loudspeaker!
Try it and report back please!
-Charlie
Room does have an influence. Lower flat ceilings 9 - 10 feet do not provoke the effect. The effect was clearly present in a room with a 20ft flat ceiling and also in a room with steeply sloping eaves as in a bungalow. The effect is not psychological and was simultaneously witnessed by many people not all being in the optimal listening position. If it was comb filtering the high ceiling would have had less. The image was extremely stable and did not wander unless stereo was panned. In this case the the image formed an arc between the speakers.
(opamps) Who would use them for an active crossover in the 21st century, except as input and output buffers?
Yer right! We want to use discretes
")
I am working on a piece of code to answer the question if we allow the resistors to differ "somewhat" in a S-K filter, can we arrive on a more accurate set of resistors to build an adjustable crossover with. Also, what sort of tradeoffs are there between various resistor ranges (e96 versus e24).
My design is fixed gain, using resistors that are "approximately" a ratio of 1 and capacitors that are a ratio of 2, each with 3 choices (100nF, 10nF, 1nF, 47nF, 4.7nF, .47nF). This results in a target Q = 0.707. I'm also assuming I have a list of target frequencies (I have ten values, then I multiply by 10 to cover 25Hz to 20kHz).
Here's an example of what my code has found.
t: 0.1%, f error range: 0.015% 1.296%, Q error range: 2.578% 3.542%, number of unique resistor values used (e96): 10
t: 6.1%, f error range: 0.015% 0.443%, Q error range: 2.571% 3.535%, number of unique resistor values used (e96): 18
So, t is the percentage that two resistors are allowed to vary from each other (with the constraint that the resulting resistors are available in the series (e96) specified), then a range of frequency errors (from target) and a range of Q errors (from target) and the total number of different resistor values needed to produce the combinations.
So, my question is - is there any thing else I should be interested in considering, during these "experiments"? How much variance in Q is acceptable, at the expense of a more accurate frequency value? Are there other unintended consequences of having the resistor values "differ somewhat"? (Obviously as the two values diverge, it impacts Q, so there's a very clear limit to what combinations should be considered)
the errors in capacitor value are not mentioned.
That could be easily modeled. As it turns out, the easiest way to deal with this might be adding a fourth capacitor at yet one more power of 10 down. This could then be placed in parallel with the other values as needed. Once actual values were chosen, then they could be measured and then a chart could be made on when exactly to engage more than one capacitor, including this fourth "adjustment" capacitor.
I could also run the simulation with a random element. The capacitors I plan on using is a type not mentioned in the book (but I would be curious if perhaps Doug would measure some!) - Rifa/EVOX MKI which are metalized polypropylene sulfide capacitors which are +/- 10%, which could be matched. For some values I would use EXFS polystyrene made by LCR components are +/- 1%.
Similarly, for the adjustable HPF. To maintain unity gain and a target Q of .707, we need resistors in a ratio of 2. But what if we let them vary slightly? Obviously the more the resistors vary, the further from our target Q we will be. However, we can get closer accuracy to a given frequency target, if there is some wiggle room.
In this output, t is the amount the two values can differ from the ideal ratio of 2:1 as a percentage of the second resistor. So, 0.001 means the values vary from 2:.99 to 2:1.01, subject to the constraint of a valid resistor in the series. Things converge nicely around about 5% allowable variance.
t: 0.001, f error range: 0.014% 60.014%, Q error range: 0.000% 0.113%, unique resistors (e24): 9
t: 0.001, f error range: 0.017% 34.032%, Q error range: 0.000% 0.113%, unique resistors (e96): 18
t: 0.006, f error range: 0.014% 60.014%, Q error range: 0.000% 0.113%, unique resistors (e24): 9
t: 0.006, f error range: 0.017% 1.010%, Q error range: 0.000% 0.266%, unique resistors (e96): 15
t: 0.011, f error range: 0.014% 60.014%, Q error range: 0.000% 0.551%, unique resistors (e24): 8
t: 0.011, f error range: 0.017% 1.010%, Q error range: 0.000% 0.266%, unique resistors (e96): 15
t: 0.016, f error range: 0.014% 60.014%, Q error range: 0.000% 0.551%, unique resistors (e24): 8
t: 0.016, f error range: 0.017% 1.010%, Q error range: 0.000% 0.266%, unique resistors (e96): 15
t: 0.021, f error range: 0.014% 32.472%, Q error range: 0.000% 1.159%, unique resistors (e24): 13
t: 0.021, f error range: 0.017% 0.906%, Q error range: 0.000% 1.055%, unique resistors (e96): 14
t: 0.026, f error range: 0.014% 32.472%, Q error range: 0.000% 1.255%, unique resistors (e24): 14
t: 0.026, f error range: 0.017% 0.517%, Q error range: 0.000% 1.196%, unique resistors (e96): 14
t: 0.031, f error range: 0.014% 15.590%, Q error range: 0.000% 1.482%, unique resistors (e24): 16
t: 0.031, f error range: 0.017% 0.517%, Q error range: 0.000% 1.338%, unique resistors (e96): 15
t: 0.036, f error range: 0.014% 7.742%, Q error range: 0.000% 1.626%, unique resistors (e24): 15
t: 0.036, f error range: 0.017% 0.517%, Q error range: 0.000% 1.338%, unique resistors (e96): 15
t: 0.041, f error range: 0.003% 6.217%, Q error range: 0.000% 1.869%, unique resistors (e24): 16
t: 0.041, f error range: 0.017% 0.517%, Q error range: 0.000% 1.976%, unique resistors (e96): 17
t: 0.046, f error range: 0.003% 5.828%, Q error range: 0.000% 2.342%, unique resistors (e24): 14
t: 0.046, f error range: 0.003% 0.517%, Q error range: 0.000% 2.283%, unique resistors (e96): 18
.
I could also run the simulation with a random element. The capacitors I plan on using is a type not mentioned in the book (but I would be curious if perhaps Doug would measure some!) - Rifa/EVOX MKI which are metalized polypropylene sulfide capacitors which are +/- 10%, which could be matched. For some values I would use EXFS polystyrene made by LCR components are +/- 1%.
I am reluctant to tie up £750 in a precision capacitor bridge which will only be used a few times.
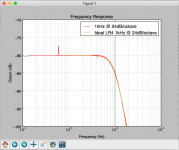
ok, i have a number of measurements from my actual circuit. I'd like to compare them to the ideal function using curve fitting function in Python. My question is, what are the proper functions to calculate gain as a function of cutoff frequency and Q?
I think for second order low-pass filter this would be:
H_LP = K / (-(f/f_c)^2+(j*f/Q*f_c)+1)
Can I just ignore j here (assume it is 1) as I'm not interested in the phase, just the magnitude?
This is for second-order (12dB/octave) and I realize that 24dB/octave is two cascaded together, but how do I get a similar equation for 24dB/octave? Same with the characteristic equation for a first-order and third-order.
I know really simple question, but this will allow me to check my circuit.
Attachments
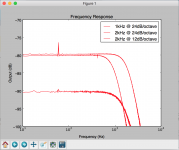
Well, this ended up being real easy!
...
Code:
import numpy
from scipy import signal

def lr(filter_order, w_center, btype='lowpass', analog=True):
  butter_order = int(filter_order / 2.0)
  num, den = signal.butter(butter_order, w_center, btype = btype, analog=analog)
  num = numpy.convolve(num, num)
  den = numpy.convolve(den, den)
  return num, den
...
Attachments
- Status
- This old topic is closed. If you want to reopen this topic, contact a moderator using the "Report Post" button.
- Home
- Source & Line
- Analog Line Level
- The design of active crossovers- Douglas Self wants your opinions