Sorry for the mix up, I have the SB17 specs handy also. Which one, the 4 or 8Ω version? Or should use Zaph specs (don't have)?
The reason for asking above is that while I do what I do, some of it is old school connect the dots, in my head that is. LATL isn't correct in all it does (obviously) but have a good enough idea to give a few specs, eg F3 of 34 etc
The reason for asking above is that while I do what I do, some of it is old school connect the dots, in my head that is. LATL isn't correct in all it does (obviously) but have a good enough idea to give a few specs, eg F3 of 34 etc
Fold/Bend Geometry & Severity ...
... will effect the frequency response of a TL as well. In this regard, you may find the attaced article [1] & [2] useful even though the domain is musical instruments operated at higher frequencies.
Regards,
WHG
... will effect the frequency response of a TL as well. In this regard, you may find the attaced article [1] & [2] useful even though the domain is musical instruments operated at higher frequencies.
Regards,
WHG
Attachments
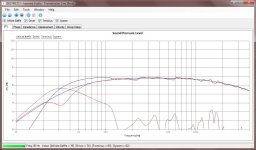
This would do an F3 of ~27Hz in a 7" x 5.5" x 58.5" line with a 2"x 3" port.
My normal way is for sub bass. Requires EQ to lower the peak, but not boomy.
Have another I'm thinking of that's 110" and with floor loading has an F3 of around 20Hz. It's a very narrow line tho, 7" x 3.25". Dampening would pose an issue loading properly but thinking outside the box might actually work... Still contemplating that one")
My normal way is for sub bass. Requires EQ to lower the peak, but not boomy.
Have another I'm thinking of that's 110" and with floor loading has an F3 of around 20Hz. It's a very narrow line tho, 7" x 3.25". Dampening would pose an issue loading properly but thinking outside the box might actually work... Still contemplating that one
Attachments
I used Zaph's measurements which are for the 8-ohm version. I provided a link to Zaph's measurements for a bunch of 6-1/2" to 7" drivers, and all you have to do to get those for the SB17 is to click on its model number, then select the T/S data.
Paul
Paul
Sorry for the mix up, I have the SB17 specs handy also. Which one, the 4 or 8Ω version? Or should use Zaph specs (don't have)?
The reason for asking above is that while I do what I do, some of it is old school connect the dots, in my head that is. LATL isn't correct in all it does (obviously) but have a good enough idea to give a few specs, eg F3 of 34 etc
I can't do anything constructive with the data you attached. How about some actual modeling graphs similar to what I provided? Those would tell the tale much better.
Paul
Paul
This would do an F3 of ~27Hz in a 7" x 5.5" x 58.5" line with a 2"x 3" port.
My normal way is for sub bass. Requires EQ to lower the peak, but not boomy.
Have another I'm thinking of that's 110" and with floor loading has an F3 of around 20Hz. It's a very narrow line tho, 7" x 3.25". Dampening would pose an issue loading properly but thinking outside the box might actually work... Still contemplating that one
In Post #39, you alluded to the differences, positive and negative, of high-aspect ratio/low-Q port and low-aspect ratio/high-Q ports and their relative locations in a line, as well as suggesting that the rest of us had no understanding of what was going on in TLs. If those statements are truly meaningful and your opinion of Leonard Audio TL software is that high, it would seem you'd have no trouble posting actual sims (modeling graphs) that clearly illustrate these facts. Against my better judgment I did exactly that using Martin King's software even though I had a strong suspicion that you either wouldn't or couldn't. It shouldn't be that difficult for you to do the same assuming, of course, that Leonard Audio's software (?) actually allows one to accurately model expected performance. So, it's time for you to show something more than just words.
Paul
Paul
How about reading up on Leonard Audio Transmission Line and install it? Don't think that is too much to ask.
Last edited:
pkitt the file contains all that info and more! I have put a few hours into this and only ask you to do a minimum and you skoff?! If you are so lame as to demand only simple "graphs" to illustrate what can be done. How lazy and lame.
I apologize DrBoar for this thread jacking
I apologize DrBoar for this thread jacking
Last edited:
I apologize, too, but I'd still would like to know if you're going to post actual modeled performance graphs from your use of Leonard Audio's TL software (or whatever it is)? You said you wanted to learn and I showed you what I was able to do. I would like to learn, also, and am expecting you to reciprocate in kind (assuming you can).
Paul
Paul
I apologize DrBoar for this thread jacking
I apologize, too, but I'd still would like to know if you're going to post actual modeled performance graphs from your use of Leonard Audio's TL software (or whatever it is)? You said you wanted to learn and I showed you what I was able to do. I would like to learn, also, and am expecting you to reciprocate in kind (assuming you can).
Paul
I can post those easily enough, as you can or anyone else can. I've wasted enough time on this triviality. Now if you wish to do this simple task, post it or not that's fine. You have tasked me to "prove myself" by giving example. I have done that, now am putting the monkey on your back and kindly ask for you to respectfully do the same, albeit in a very minimal way. Simply open the TLP file and Presto all the information you demand.
and I misspoke the F3 would be closer to 30Hz.
These are the corrections used
10Hz = +8dB
15Hz = +6.67dB
20Hz = +5.33dB
30Hz = +4dB
40Hz = +2.67dB
60Hz = +1.34dB
80Hz = 0dB
200Hz = 0dB
300Hz = -3dB
400Hz = -6dB
600Hz = -9dB
800Hz = -12dB
1200Hz = -15dB
1600Hz = -18dB
2400Hz = -21dB
3200Hz = -24dB
These are the corrections used
10Hz = +8dB
15Hz = +6.67dB
20Hz = +5.33dB
30Hz = +4dB
40Hz = +2.67dB
60Hz = +1.34dB
80Hz = 0dB
200Hz = 0dB
300Hz = -3dB
400Hz = -6dB
600Hz = -9dB
800Hz = -12dB
1200Hz = -15dB
1600Hz = -18dB
2400Hz = -21dB
3200Hz = -24dB
Scott saw your request for the same. The reason for my resistance was due mostly due to the fact I had requested the same, with a as a responce
pkitt, I asked for you to post up additional graphs and you scoffed. Like it was necessary to have. It wasn't, simply asked as I cannot do direct comparisons between the two methods. Nothing more.
Now while being in an enormous amount of pain (thanks for asking) and putting hours into giving you (or anyone else) an example felt enough was enough with the games.
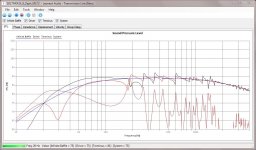
This is the similar, but using Zaphs specs.
Apply the corrections to this.
as a responce pkitt, I asked for you to post up additional graphs and you scoffed. Like it was necessary to have. It wasn't, simply asked as I cannot do direct comparisons between the two methods. Nothing more.
Now while being in an enormous amount of pain (thanks for asking) and putting hours into giving you (or anyone else) an example felt enough was enough with the games.
This is the similar, but using Zaphs specs.
Apply the corrections to this.
Attachments
I posted the most important graphs resulting from my modeling, so why are you saying I've come up short somehow. Also, when I open your attachment it's a text document without any graphs. I provided actual graphs that did not require you to do anything other than look at them, yet you're expecting me to have to download the design software you used in order to see actual results? This is not at all trivial as you made claims in Post 39, that you have so far failed to back up, plus you implied/suggested the others didn't know what they were doing.
Paul
Paul
I can post those easily enough, as you can or anyone else can. I've wasted enough time on this triviality. Now if you wish to do this simple task, post it or not that's fine. You have tasked me to "prove myself" by giving example. I have done that, now am putting the monkey on your back and kindly ask for you to respectfully do the same, albeit in a very minimal way. Simply open the TLP file and Presto all the information you demand.
I'm sorry you're in pain; I certainly had no intention of making that worse and apologize if I did.
I would have been happy to post additional graphs but you didn't specify what you wanted to see, and in actuality the graphs I did post were the most useful ones for making comparisons IMO. I could have provided graphs for driver excursion, port air velocity, impulse response, for instance, and several others.
So now you've finally posted a graph but it can't be read directly; you have to make SPL corrections versus frequency?! That seems kind of lame, don't you think, and brings into question the usefulness of the design software you've chosen.
You started this "frivolous" exchange with statements of your TL design superiority along with thumbing your nose at others' intelligence. So far you haven't proven anything.
Paul
Scott saw your request for the same. The reason for my resistance was due mostly due to the fact I had requested the same, with a
pkitt, I asked for you to post up additional graphs and you scoffed. Like it was necessary to have. It wasn't, simply asked as I cannot do direct comparisons between the two methods. Nothing more.
Now while being in an enormous amount of pain (thanks for asking) and putting hours into giving you (or anyone else) an example felt enough was enough with the games.
This is the similar, but using Zaphs specs.
Apply the corrections to this.
I'm sorry you're in pain; I certainly had no intention of making that worse and apologize if I did.
I would have been happy to post additional graphs but you didn't specify what you wanted to see, and in actuality the graphs I did post were the most useful ones for making comparisons IMO. I could have provided graphs for driver excursion, port air velocity, impulse response, for instance, and several others.
So now you've finally posted a graph but it can't be read directly; you have to make SPL corrections versus frequency?! That seems kind of lame, don't you think, and brings into question the usefulness of the design software you've chosen.
You started this "frivolous" exchange with statements of your TL design superiority along with thumbing your nose at others' intelligence. So far you haven't proven anything.
Paul
No I think the frivolousness is on your part and you took it personally. I asked for additional info, which you refused to supply. Posted the corrections so they are readable by those not familiar with the issues the software still has (and has been mentioned repeatedly here and in the software's own thread). None the less it does work. Sorry I don't have on my machine what you have but when the corrections are applied proves enough on it's own. As for "my choice" sorry you feel that this "beta" software isn't up to your standards. Perhaps whining to the author about it instead would make you feel better. Really what was your point in the first place, to have an intelligent conversation or an oversized chip on your shoulder with a grudge? I'm on the fence here, can go either way, it's your choice.
This all started with your statements in Post 39 in which you made specific allegations that there was something inherently wrong with locating a driver at 20% from the line's beginning, as well as your accusations that others, including me presumably, weren't intelligent enough to know what we were doing when we design TLs due to our not understanding high/low aspect port ratios with low/high Qs (I have paraphrased your words for convenience). I simply wanted you to show in easily readable graphical form, like I did, what you were talking about. If the beta software you're so thrilled with isn't completely debugged or doesn't yet have the necessary abilities to do a complete design, it really makes it difficult to make direct comparisons or place much faith in its accuracy. Hopefully when it's done, it will be a really good tool, one I will want to try. I didn't actually refuse to provide you more information, even though I wondered why it was necessary, and you did not specify exactly what you wanted/needed. I have no chip on my shoulder, nor do I like to toot my own horn. I'm not about to suggest that I'm an expert at designing TLs, or anything else for that matter, but I do have a known track record as I described in one of my earlier posts. I will take another look at the graphs you did post and apply the corrections to see the comparisons.
Paul
Edit: I just finished comparing the response graph for the SB17 you provided in Post 72 to the first graph of 6 that I provided in Post 54. I made the SPL corrections you provided at frequencies of 20 Hz to 800 Hz. Your design had ~6 dB more output at 20 Hz, ~3 dB more at 30 Hz and ~1 dB more at 40 Hz. From 60 Hz to 200 Hz, our two designs had identical SPL outputs. Above 200 Hz, however, your design started dropping off in output compared to mine, -3 dB at 300 Hz and increasing to -13 dB at 800 Hz. I assume your design has more output than mine below 40 Hz due to a slightly different stuffing density/location but maybe not. Don't know why, though, your design's output dropped of so much above 200 Hz. And, I still don't have a clue about benefits/problems you talked about with high-aspect ratio/low-Q and low-aspect ratio/high-Q ports or their locations.
No I think the frivolousness is on your part and you took it personally. I asked for additional info, which you refused to supply. Posted the corrections so they are readable by those not familiar with the issues the software still has (and has been mentioned repeatedly here and in the software's own thread). None the less it does work. Sorry I don't have on my machine what you have but when the corrections are applied proves enough on it's own. As for "my choice" sorry you feel that this "beta" software isn't up to your standards. Perhaps whining to the author about it instead would make you feel better. Really what was your point in the first place, to have an intelligent conversation or an oversized chip on your shoulder with a grudge? I'm on the fence here, can go either way, it's your choice.
Last edited:
And I supplied the TLP file to hand you EVERYTHING! Yawn
Now while I'm still working out why I can't run what you are, don't see any reason under the sun why you cannot oblige me with installing the software yourself and opening the TLP file and read the thread. But I digress, this wasn't something you would do if your life depended on it.
So I was in fact correct to think that this wasn't about having an intelligent conversation. Instead you did take what was said in "general" personally. With that "I'll take this guy down" and nit pick everything to death just to show how much a twit he is. LOL
LOAD the software, open the file, apply the corrections and comment on the merits or the lack of. 25-35 years ago demanding such caca would have gotten you laughed out of the park. Sure I'll whip out my trusty ol Ti59 and the program cards load up the software I wrote back then and post a hand made connect the dots graph. Would that be better?! Suppose you would come off with some lame comment that the calculator wasn't as good as a HP41c or some such (btw had that one too). If you really want to travel back try doing this on a Commodore PET < my first computer. Yes this "new kid on the block" has been building speakers for over 37 years now. Both Pro and for the home. How many antenna's have you designed, how much RF theory do you have under your belt. None that I can see, but then building speakers hasn't been my primary field, EE and RF design is. Speaker design is my hobby. I don't have an axe to grind like you do but when I see obvious errors in another design I'm compelled to speak up and plan to continue doing so for the foreseeable future.
Now while I'm still working out why I can't run what you are, don't see any reason under the sun why you cannot oblige me with installing the software yourself and opening the TLP file and read the thread. But I digress, this wasn't something you would do if your life depended on it.
So I was in fact correct to think that this wasn't about having an intelligent conversation. Instead you did take what was said in "general" personally. With that "I'll take this guy down" and nit pick everything to death just to show how much a twit he is. LOL
LOAD the software, open the file, apply the corrections and comment on the merits or the lack of. 25-35 years ago demanding such caca would have gotten you laughed out of the park. Sure I'll whip out my trusty ol Ti59 and the program cards load up the software I wrote back then and post a hand made connect the dots graph. Would that be better?! Suppose you would come off with some lame comment that the calculator wasn't as good as a HP41c or some such
(btw had that one too). If you really want to travel back try doing this on a Commodore PET < my first computer. Yes this "new kid on the block" has been building speakers for over 37 years now. Both Pro and for the home. How many antenna's have you designed, how much RF theory do you have under your belt. None that I can see, but then building speakers hasn't been my primary field, EE and RF design is. Speaker design is my hobby. I don't have an axe to grind like you do but when I see obvious errors in another design I'm compelled to speak up and plan to continue doing so for the foreseeable future.Oh puhleeez stop this off topic exchange. I have to agree that results of final graphs should be posted and not input files. I use AkAbak and I would not expect anyone to have to load AkAbak onto their pc and learn how to run it and produce plots from my script files. For one thing, AkAbak doesn't install on newer 64 bit operating systems, and two, posting results lets ANY reader on this forum look at the results immediately. What it so hard about posting final plots?
At minimum we like to see SPL vs freq, the Impedance vs freq, then cone excursion vs freq, and if you have time, impulse response, port velocity, polar directivity etc.
At minimum we like to see SPL vs freq, the Impedance vs freq, then cone excursion vs freq, and if you have time, impulse response, port velocity, polar directivity etc.
- Status
- This old topic is closed. If you want to reopen this topic, contact a moderator using the "Report Post" button.
- Home
- Loudspeakers
- Multi-Way
- Pipe fold geometries and harmonic patterns