Jay, a pulse test will tend to reveal highly nonlinear behavior in an amp. At pulse frequencies, some transistors may saturate, or the gain of the amp will change dramatically, and this causes anomalous behavior at the beginning and ends of the squarewave. So the results of a fast square wave test often aren't an indicator of amp quality at normal listening levels. To understand behavior at listening levels use a very small squarewave, which won't cause nonlinearity. If the frequency response has a peak or rises in the ultrasonics, it will be seen as ringing or overshoot.
The distinction being made here is pulse test vs. response test. A pulse test is designed to push the amplifier to it's limits so it's worst behavior can be observed. A response test aims to understand amp behavior at normal operating conditions.
In Mooly's amp, you can see that the falling edge is normal, but the rising edge is slew-rate limited because the input transistor is turned fully off.
Pulse test behavior can be obscured by the input low-pass/RF filter, so it should be disconnected before such a test.
The software simulates the best it knows how. Most of the time it is not software errors that cause a difference from real life, but lack of needed information in the models or inaccurate information. And every transistor is a little different, so some variation of real life from even good models should be accounted for. Large differences between real life can often be tracked down to a model with overly large capacitances, or a wrong Hfe curve. It can also be layout issues such as trace inductances and resistances which haven't been included in the simulation. FET transistor models can have the wrong Vgs/Id curve, which is something to watch out for.
Generally amps are designed so they can output near the rails into the chosen load. "Worst case" testing is sort of vague because you are never sure what the worst case is. Some amps will max out with .3V input, it just depends on the amp's gain. Power limit is almost always based on thermal limits, so you will need to measure the power dissipation of the transistors in simulation and do the math with the heatsinks.
Sometimes the worst case could be a 10V pulse on the input, causing the input transistor to be destroyed. An amp should have a diode input limiter, in case for instance on a cold, dry day someone shuffles over to the amp and zaps the input connector.
Last edited:
Hey, awkward silence.
Mooly, how do you like simulation so far?
It's good...
") I can see the benefits of using it and seeing trends in distortion patterns is interesting for me.
I can see the benefits of using it and seeing trends in distortion patterns is interesting for me. I've just been having a bit of a break this last few days and doing other stuff while the weathers so nice here.
And I've spent the last week trying Windows 8 Preview (Yes LTSpice seems to run just fine on it). W8 that's another story though... I'll take Vista each and every time so far.
Thanks for asking... no doubt be back trying stuff with it very shortly.
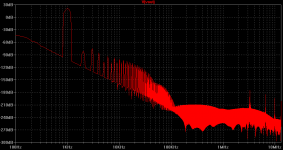
Those spikes up in the MHz area.. are those the frequencies where the amplifier is prone to oscillation...?? The high order order (Above 4th) are typical for amplifers with hard turn on/off of the output bjt's... You can simulate deeper in the circuit if you disconnect the servo and magke caps big...1F
Those spikes are artefacts of the FFT. My FFT is actually set at several times more samples than my simulation. The spike occur where the frequency resolution of the input samples runs out, and after that the FFT just makes up stuff... Man I wish SPICE wasn't like this.
The amp is actually quite stable.
The amp is actually quite stable.
thanks.. I get the same kind of spikes in some of my simulations...
Do you have en easy method of plotting output resistance...I want to analyse some mirrors and current-sources, what happens when you add helper transistors change to fet's and cascode them..
When making current feedback the impedance of the current-source is the floor everything stands on.. I believe much can be gained there.
As you may already know, look to the Hawksford and Baxandall cascodes for very high-impedance current sources. But current sources can't be stabilized sufficiently with miller capacitance without losing what you gained in the first place. You may gain a semblance of stability but it will be conditional. You will probably need some sort of shunt compensation instead, possibly with a series R.
To plot output resistance is easy if you know how. Use a spice current source pointing into your circuit's output. Set this source to be the AC analysis source. In AC analysis the input signal always has a level of 1 or 0db (but without computing any nonlinearity so it's not literal). So by ohm's law Vout/1A=Rout, Vout=Rout. So just plot the output voltage and you will have the output impedance.
To plot output resistance is easy if you know how. Use a spice current source pointing into your circuit's output. Set this source to be the AC analysis source. In AC analysis the input signal always has a level of 1 or 0db (but without computing any nonlinearity so it's not literal). So by ohm's law Vout/1A=Rout, Vout=Rout. So just plot the output voltage and you will have the output impedance.
Here is an FFT of my latest creation. It is an all-BJT class AB amp with a rather unconventional input stage and stability compensation. This is at 18V into 6R. Does this look like a "good" spectrum to you? It sounds incredible on my bench!
It's how it sounds to you that matters most. The 3Khz 3rd harmonic is perhaps a little prominent but that's probably output stage related. If you make the load 60 ohms instead of 6 it will probably disappear. If you like what you hear then pursue the design further. See how the distortion changes into different speaker impedances...
I found with the Mosfet amp of mine that it sounds really good running at a lowish bias, even below the 100ma "standard" value quoted for laterals. That low value changes dramatically the way the distortion alters into a low impedance load of course. Yet working "against" that is the single ended input stage and it's predominantly even harmonic spread. At low listening levels the amp sounds fantastic. There's no right and wrong.
So it really is how it all comes together into the speakers and listening environment that matters.
From Wikipedia:
https://en.wikipedia.org/wiki/Window_function#Windowing
So in terms of accuracy, the rectangular window would probably be the worst offender for audio work.
The other way round - provided you correctly choose input frequency.
DFT (Discrete Fourier Transform; FFT is an implementation of DFT) works with frequencies which can be expressed as
Fk = k * Fs / N
where Fs is sampling frequency, N is number of samples,.k is an integer in 0 .. N/2 rage (for simplicity I assume N is even).
The set of Fk frequencies are called DFT bin frequencies. Bin frequencies exactly fit the window - I mean, there is integer number of periods. k is called DFT/FFT bin number.
If input frequency is a bin frequency, there is no spectral leakage; rectangular windows yields the best possible spectral resolution.
Non-rectangular windows are needed for non-bin frequencies. Sine waves of non-bin frequencies get "chopped" at window side(s), so the effect of chopping is mitigated by bell-shaped windows.
...
In simple English - don't mess up with non-bin frequencies.
OTOH, if you are using DFT/FFT to process real music, the music doesn't care about the non-bin frequencies, so bell-shape windowing is necessary.
In any case, multiplying input signal by a a window (unless it is a full buffer length rectangular window - in this case it's a NOP == No OPeration) is a non-linear operation.
That won't work for LTSpice, because circuit drift creates non-integer and non-bin frequencies; that is why we need the Hann window. In the case drift is eliminated, usually there is no need for special sample settings.
Circuit drift (e,g. exponentially decaying settling) should sooner or later become lower than accuracy of interest.
Other people have already suggested to simulate until no change occurs.
The no change should be understood within some tolerance. For example, if you intend to use you circuit with a DAC, and the DAC is a 34 bits one, imperfections at, say, 1 / (2 ^ 26) level, i.e. one bit of 26 bits scale, i.e. 2 spare bits of precision, should be OK.
It works to simulate as long as it takes for the circuit to settle, but this can take a long time. It is a valid method, but somewhat inconvenient.
Unless the circuit has settled, you can't be sure in THD. Due to "Simple twist of fate" you can get lower than in reality THD - the settling curve spectrum components may incidentally have opposite phase with WRT THD components you are trying to measure.
<snipped>
To plot output resistance is easy if you know how. Use a spice current source pointing into your circuit's output. Set this source to be the AC analysis source. In AC analysis the input signal always has a level of 1 or 0db (but without computing any nonlinearity so it's not literal). So by ohm's law Vout/1A=Rout, Vout=Rout. So just plot the output voltage and you will have the output impedance.
Sorry to respond to such an old post but I just wanted to mention that when plotting the output impedance with the setup described above, you can have it plot Ohms, with Ω symbols as the units, by first plotting the output voltage and then right-clicking on its plot title and changing the expression of what is plotted, adding the division by the current source's current. i.e. If you plotted V(out) and the current source was named I1, then you would change V(out) to V(out)/I(I1).
For longer current-source names, it's sometimes easier to first plot the current, too, then right-click on its plot title, highlight its name in the expression field, hit Ctrl-C or right-click-COPY, click the "delete this trace" button, right-click the voltage's plot title, and then enter / then hit Ctrl-V or right-click-PASTE.
Unless the circuit has settled, you can't be sure in THD. Due to "Simple twist of fate" you can get lower than in reality THD - the settling curve spectrum components may incidentally have opposite phase with WRT THD components you are trying to measure.
This would seem to have the worst effect on rectangular windowing because it has so much spectrum leakage.
In my simulations and with the command set I provided, the first several cycles are not recorded, allowing the impulse caused by the suddenly starting sine wave to dissipate. After this only very low frequency spectral components are left. I always make sure the drift spectral leakage is well below the harmonic levels, say 40db, in which case the harmonics are not altered by more than 1%.
Gootee, there is also the option in Control Panel -> Waveforms to replace "ohm" with the omega symbol, this makes the scale less crammed.
If you have an expression like 1/Ie(Q7) and you want the display to indicate ohms, you need in indicate the the 1 is a voltage. So if you use the expression 1V/Ie(Q7) the scale will indicate ohms.
This would seem to have the worst effect on rectangular windowing because it has so much spectrum leakage. ...
Rectangular window has the minimal spectral leakage. I think you confuse spectral leakage due to window with spectrum leakage due to non-bin frequencies. Essentially, when apply a window you exchange one for the other.
If you multiply input set of samples by bell-like window, you do amplitude modulation using as the modulating signal half-sine (for Hanning window) wave whose period is 2 * N where N is number of samples.
Amplitude modulation causes appearance of two side bands - each side band is +/-F, where Fm is the modulating frequency, from your carrier.
I.e. by applying bell-like window you create for every spectral component (for every FFT bin) two sidebands, hence the spectral leakage.
Since the bell-like window looks more or less like half sine wave, it spectrum is not limited to 1 / (2 * N) sidebands.
...
To make long story short, when you apply bell-like window, you cheat. You cheat in favor of getting rid of unpleasant artifacts, but the artifacts is the reality of DFT.
In order not cheat let the simulation settle as I wrote above.
- Status
- This old topic is closed. If you want to reopen this topic, contact a moderator using the "Report Post" button.
- Home
- Design & Build
- Software Tools
- LTSpice FFT simulation settings and inconsistent results.