Sloppy on my part. I transferred the idea to the transformer without thinking about it. Is that because the voltage difference is supplied by the preceding stage?
No, the energy is stored in the inductance of the transformer primary winding. (OPT or interstage) In an ideal output stage the available voltage swing would be 2X the supply voltage, in practice it is somewhat to significantly less.
So in effect the fact there's an idle current through the inductor, as it's connected to the H.T., means when that fluctuates due to signal then it can swing more volts? Like an inductor arcing to keep the current flowing if it's suddenly cut off? Thanks for pointing that out - I'm going to read up on it now, and also to try what a 600R loadline looks like on the 6S41S.
An inductor may arc if that is the only way it can keep the current flowing when a switch is opened. This is just an extreme case of the inductor putting out a voltage which tries to maintain current flow. For short period of time, an inductor can have a current through it in the opposite direction to the applied voltage.
1.2K new calculations
Hullo all,
I've had a period of being rather confused by the differences I was getting between Steve Bench's distortion calculations (in his first article on loadlines) and Norman Crowhurst's, in the second article of his "Designing an Amplifier" series here.
For the ones I started this thread with (~30% with Bench's) I was getting ~2% from Crowhurst and I couldn't see how I was out by a factor of 10; one of them was mistaken, or I had missed a glaring error in my mathematics!
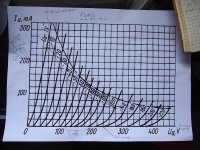
However I've spent a few hours redrawing them (which I'm finding quite fun - it's nice to find a post-University occupation that taxes the faculties somewhat!) and I've come up with the attached 1.2K one that seems pretty good, and Bench and Crowhurst roughly agree (5.2% and 6.8% respectively at 2nd harmonic). The curved red line is 70% of the maximum dissipation, which I was using until I realised that if it were a push-pull amplifier the average dissipation would be less anyway so it seemed less critical to try to squeeze extra life out by lowering the power. The black loadline is my 1.2K plot.
In the third and fourth harmonics I get 0% with Bench's calculations! If anyone has the time to glance over these results I'd be most grateful. Below are my calculations, in case I've made an obvious error.
Quiescent point: 180V/140mA, -60V on grid.
Crowhurst:
Maximum positive excursion from 180V is 275V (Vg = -120V); negative is 55V (Vg = 0V).
Symmetrical midpoint is (275 + 55)/2, or 165V. This is 15V from the actual midpoint of 180V, so 2nd harmonic is 15/(275-55) x100% or 6.8%.
Bench:
Ia = 245mA
Ib = 190mA
Ic = 140mA
Id = 95mA
Ie = 55mA
2H(%) = 75*(Ia + Ie - 2*Ic)/(Ia + Ib - Id - Ie)
= 75*(245 + 55 - 280)/(245 + 190 - 95 - 55)
= 1500/285 = 5.2
3H(%) = 50*(Ia - (2*Ib) + (2*Id) - Ie)/(Ia + Ib - Id - Ie)
= 50*(245 - 380 + 190 -55)/285
= 0
4H(%) = 25*(Ia - (4*Ib) + (6*Ic) - (4*Id) + Ie)/(Ia + Ib - Id - Ie)
= 25*(245 - 760 + 840 - 380 + 55)/285
= 0.
Thank you most kind for reading so far!
Hullo all,
I've had a period of being rather confused by the differences I was getting between Steve Bench's distortion calculations (in his first article on loadlines) and Norman Crowhurst's, in the second article of his "Designing an Amplifier" series here.
For the ones I started this thread with (~30% with Bench's) I was getting ~2% from Crowhurst and I couldn't see how I was out by a factor of 10; one of them was mistaken, or I had missed a glaring error in my mathematics!
However I've spent a few hours redrawing them (which I'm finding quite fun - it's nice to find a post-University occupation that taxes the faculties somewhat!) and I've come up with the attached 1.2K one that seems pretty good, and Bench and Crowhurst roughly agree (5.2% and 6.8% respectively at 2nd harmonic). The curved red line is 70% of the maximum dissipation, which I was using until I realised that if it were a push-pull amplifier the average dissipation would be less anyway so it seemed less critical to try to squeeze extra life out by lowering the power. The black loadline is my 1.2K plot.
In the third and fourth harmonics I get 0% with Bench's calculations! If anyone has the time to glance over these results I'd be most grateful. Below are my calculations, in case I've made an obvious error.
Quiescent point: 180V/140mA, -60V on grid.
Crowhurst:
Maximum positive excursion from 180V is 275V (Vg = -120V); negative is 55V (Vg = 0V).
Symmetrical midpoint is (275 + 55)/2, or 165V. This is 15V from the actual midpoint of 180V, so 2nd harmonic is 15/(275-55) x100% or 6.8%.
Bench:
Ia = 245mA
Ib = 190mA
Ic = 140mA
Id = 95mA
Ie = 55mA
2H(%) = 75*(Ia + Ie - 2*Ic)/(Ia + Ib - Id - Ie)
= 75*(245 + 55 - 280)/(245 + 190 - 95 - 55)
= 1500/285 = 5.2
3H(%) = 50*(Ia - (2*Ib) + (2*Id) - Ie)/(Ia + Ib - Id - Ie)
= 50*(245 - 380 + 190 -55)/285
= 0
4H(%) = 25*(Ia - (4*Ib) + (6*Ic) - (4*Id) + Ie)/(Ia + Ib - Id - Ie)
= 25*(245 - 760 + 840 - 380 + 55)/285
= 0.
Thank you most kind for reading so far!
Attachments
So you think the calculations are reasonable? I did one at 2.4K while experimenting, but got worse results than for the 1.2K. However, the operating point was different, so now dinner's out of the way I'll see how that works.
Right, with the same quiescent point, 2.4K gives:
H.D.2: Crowhurst 5.1%; Bench 2.34%.
H.D.3: 4.7%
H.D.4: 3.9%.
So from the calculations 1.2K wins as in P-P the evens will cancel giving 0 in total. If only it were that easy!
Right, with the same quiescent point, 2.4K gives:
H.D.2: Crowhurst 5.1%; Bench 2.34%.
H.D.3: 4.7%
H.D.4: 3.9%.
So from the calculations 1.2K wins as in P-P the evens will cancel giving 0 in total. If only it were that easy!
Last edited:
So you think the calculations are reasonable? I did one at 2.4K while experimenting, but got worse results than for the 1.2K. However, the operating point was different, so now dinner's out of the way I'll see how that works.
Right, with the same quiescent point, 2.4K gives:
H.D.2: Crowhurst 5.1%; Bench 2.34%.
H.D.3: 4.7%
H.D.4: 3.9%.
So from the calculations 1.2K wins as in P-P the evens will cancel giving 0 in total. If only it were that easy!
Look ok to me.. It never is (that easy) of course,
 and the numbers you get from the calculations are only approximations.. Give something in the range of 1.4 - 1.6K a test.. It could be that 1.2K is close to optimal. IMLE the end result is usually a little better than the calculations hint at, but YMMV..
Many thanks for all the responses. So, the next point I'm racking my brains with is the issue of the changing impedance/turns ratio turkey. From poring over my books and the Infobahn I don't understand how having plotted a suitable single-ended loadline I then can get to knowing the AB crossover point, or if the loadline's impedance is the OPT value...or if I'm barking up the wrong tree entirely!
Thanks Miles, but alas that was one of the threads I've already printed out and have been perusing! He just refers to the "Class B loadline" and the "DC loadline" without specifying what they are.
Crowhurst and Jones seem to have little to say on the subject. I had the impression from Jones that if one plotted a suitable Class A loadline then that's it done, as he thinks composite loadlines are a waste of time. However it seems from threads like the Hawthorne Audio one and other sources that setting an AB bias point with a class B loadline is a necessity for calculating the previous stage, whether using composite lines or extrapolating from one valve.
Crowhurst and Jones seem to have little to say on the subject. I had the impression from Jones that if one plotted a suitable Class A loadline then that's it done, as he thinks composite loadlines are a waste of time. However it seems from threads like the Hawthorne Audio one and other sources that setting an AB bias point with a class B loadline is a necessity for calculating the previous stage, whether using composite lines or extrapolating from one valve.
There's 5 parts about load lines that should be useful here.
Steve's Tube Pages
Steve's Tube Pages
Thanks rock4016, but I've been using those too!
I don't know if I need to restrict the point to 180V, I just thought the curves looked pretty decent there and the calculations came out well. Perhaps for AB I'll need to alter it somewhat, but none of my research seems to explain that yet!
I'll rephrase my questions of a few posts ago:
If I've got for example the single-ended 1.2K loadline of a few pages back then for PP do I plot that as a composite loadline, making the OPT primary 4.8K anode to anode?
How do I go about calculating for class AB, especially the 'class B loadlines' mentioned in a few articles around the 'net?
- Status
- This old topic is closed. If you want to reopen this topic, contact a moderator using the "Report Post" button.
- Home
- Amplifiers
- Tubes / Valves
- Loadlines and distortion (6S33S/6S41S)