makes sense, the noise floor difference thingy might explain the curve discontinuity at 1 Watt, probably would've intersected the latest measured data too.
The jump in THD+N at 1 W in the data sheet measurements is caused by a range change on the AP SYS 2. The input attenuator clicks up a notch. This attenuates the signal (and harmonics), but the noise floor is unchanged --> higher THD+N
I've seen the same on my HP 8903A, actually.
~Tom
Interesting, I'm going to have to do some thd tests at higher frequencies on my p2p GC. Main thing I'm doing different is all ground's return to the star point on the PS PCB between the caps. Moving that to a different point and running a single wire to there may prove beneficial...
Tony.
Tony.
I think the most important thing is to have one star ground reference for the circuit. If your main supply caps are right on top of the LM3886, the ground star can be between them. But if the caps are off some place (as they tend to be due to their size), you're better off creating a local ground star at the LM3886 local decoupling and running a wire from there to the center between the caps. My measurements show that quite clearly (look a few pages back).
~Tom
~Tom
I'd recommend 33 nF + 8.2 Ω, 1 W.
I prefer to calculate the power dissipated in the resistor rather than relying on experiments with dubious sources. P = f*C*V^2. f is the worst-case frequency (highest freq), C is the capacitance, V is the worst case RMS voltage. Derate the resistor by a factor of 3~4, otherwise it gets screaming hot (250 ºC).
~Tom
Interesting, I'm going to have to do some thd tests at higher frequencies on my p2p GC. Main thing I'm doing different is all ground's return to the star point on the PS PCB between the caps. Moving that to a different point and running a single wire to there may prove beneficial...
Tony.
I soldered Rf and and the caps to the beginning of each chip pin, removing most of the leads as possible, solder the two caps together, this is the star, 0V and speaker return, connect the speaker and rails to the end of the chip pins. Use thin wires for audio-in and Mute circuit. I connect the audio-in and speaker cables directly to the amp. My choice of caps would be 0.1, <100, <4700uF, but I have no way of measuring if this is the best solution. I think tomchr is using a regulated PSU anyway.
Last edited:
Yep. I'm using regulated supplies. At home, I have an HP 6228B (2x50 V, 1 A). At work, I used two Agilent E3632A (30 V, 4 A). I ran the LM3886 at ±28 V.
I was aiming to measure the performance of the LM3886 - not the supply - hence the use of lab supplies...
~Tom
I cant see where the chip begins and the PSU ends.
You have shown improvement with a better layout. The PSU and caps are maybe just as important??????? Your PSU setup maybe the best solution, its just not the standard "gainclone" solution.
I was aiming to measure the performance of the LM3886 - not the supply - hence the use of lab supplies...")
Would it be feasible for you to configure your AP to measure the amplitude of the supply noise at the power pins of the LM3886? A plot of level vs stimulus freq at 10-15W into your dummy load would be quite illuminating to get a handle on how much the PSRR is likely to be affecting how the amp sounds.
Interesting for sure but rather difficult to achieve because the ripple is a wideband noise, tricky to generate that direct from any standard siggen. The requisite waveform could however be created in-situ by hanging another amp chip off the same rails and back-driving that one's output with a third amp via an 8R resistor.
Your PSU setup maybe the best solution, its just not the standard "gainclone" solution.
True. It's all downhill from here in terms of performance. Though, with decent reservoir caps, I suspect you can get very, very close to the performance I measure with the lab supplies.
Would it be feasible for you to configure your AP to measure the amplitude of the supply noise at the power pins of the LM3886?
Sure. Don't expect it to happen overnight, but I do plan to look at the LM3886 supply variation vs frequency.
What would be new here is to measure chip input/output with different PSU noise (ripple), instead of looking at only the PSU output under different loads.
So measure the PSRR? I'm not sure what information you'd get beyond what's already in the data sheet.
~Tom
Interesting for sure but rather difficult to achieve because the ripple is a wideband noise, tricky to generate that direct from any standard siggen. The requisite waveform could however be created in-situ by hanging another amp chip off the same rails and back-driving that one's output with a third amp via an 8R resistor.
Wideband noise is easy to generate, with the right generator. Most modern function generators can do it. As can the generator in my HP 3562A. All you really have to do is run some current through a diode to get white noise. Then you gain it up. Voila! Noise...
The way to do the PSRR measurement would be to have a separate amp delivering the supply voltage for the LM3886 under test. Drive the "supply amp" to achieve the desired supply disturbance.
~Tom
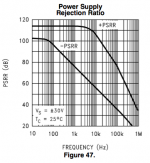
The DS shows the PSRR only for open-loop operation. It would be instructive to see what happens when the loop's closed. When I tried simming the LM3886 schematic for PSRR in LTspice (closed loop) I couldn't reach the theoretically predicted performance at the lowest frequencies.
<edit> when I wrote 'a wideband noise' I wasn't sufficiently clear. I didn't mean to say that the supply ripple was the same as wideband noise. It isn't - for a single sinewave output its discrete harmonics. It approaches noise-like characteristics for music though.
<edit> when I wrote 'a wideband noise' I wasn't sufficiently clear. I didn't mean to say that the supply ripple was the same as wideband noise. It isn't - for a single sinewave output its discrete harmonics. It approaches noise-like characteristics for music though.
Last edited:
The DS shows the PSRR only for open-loop operation. It would be instructive to see what happens when the loop's closed.
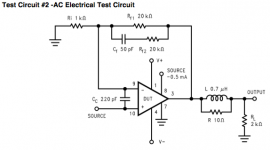
Um. No... It shows the PSRR for closed loop operation. The AC test circuit would be used for the measurement. No measurements on an op-amp are run open-loop.
When I tried simming the LM3886 schematic for PSRR in LTspice (closed loop) I couldn't reach the theoretically predicted performance at the lowest frequencies.
I'm not sure what you mean by "LM3886 schematic". If you copied the LM3886 equivalent circuit schematic but used discrete devices (and their respective models), you would get very different performance. If you simulated an LM3886 model and the model included the supply related effects, you should get close to the data sheet performance.
Does a 100 Hz sawtooth shaped ripple of 5 volts have no effect on the chips performance?
Never been tested at DiyAudio.
Are you only going to test THD + N????
RELAX!! This is a hobby for me. I have other commitments in life. My little PCB vs P2P experiment is part of a bigger project. However, in order for me to proceed with the bigger part of the project, I needed the LM3886 circuit to deliver the performance promised in the data sheet. When I started out, that was not the case for the P2P circuit and barely the case for the non-optimized PCB circuit. The THD+N measurement provides a nice figure-of-merit. As we saw earlier, it doesn't take much to screw up the THD+N, so using that as a confidence measurement makes sense to me.
I do not see a point of measuring every data sheet parameter myself as the design and applications engineers at National Semiconductors have already done a wonderful job at that. The performance you see in the NSC data sheets are measured results of many parts. Some of the parameters are measured on thousands of parts for the generation of the data sheet curves. All the parameters in the Electrical Characteristics table are measured in production. Every part is tested. Now, that may not be the case for all manufacturers out there. But that was the case for NSC. TI is continuing that tradition (thankfully).
The data sheet curves show the performance of a typical part (averaged from the measurement of many parts). The table shows the test limits (min/max). You have to be a bit leery of data sheets that only show typical specs. That usually means that parameter is not tested in production (usually for cost reasons).
There is really no point in measuring the THD with the supply wiggling. It's the wrong measurement. Recall, THD = [power of harmonics]/[power of fundamental]. A spectrum of the output signal would be a better measurement. Then again, the result can be deduced from the PSRR plot. If you apply a 6 kHz, 1 V sine wave to the VEE supply, you should get 1 mV on the amp output (60 dB PSRR). If you want to predict the effects of a triangle wave, look up the Fourier series, figure out the harmonics, and do the math.
~Tom
Attachments
An experiment doesn't prove anything. It either shows support for a theory or fails to show support for a theory.
We agree that any supply current drawn by the amp will cause the supply to sag, right? If you have a sine wave input, you'll get a half-wave rectified sine wave current (plus a little DC) on either supply. This supply wiggle will be attenuated by the PSRR but you will find some (usually small) fraction of it present on the output in addition to the desired sine wave output. Are you with me so far?
So we need to know the supply bounce versus output signal amplitude (or probably load current amplitude, but output voltage is easier to deal with - we can just make a trace for 8 ohm load and one for 4 ohm load). From the measurement of the supply bounce, we can calculate the amount of supply-induced voltage on the output and compare that with the desired output signal voltage.
Now the question becomes how low a PSRR you can get away with before someone with golden ears will perceive a difference between "good enough PSRR" and "not enough PSRR" in a double/triple blind test. I don't know the answer to that.
A common FOM for the threshold of perception of THD (yes, different than PSRR) is -50 dB (0.3 %). I would assume that the threshold for perceptible supply-induced disturbances is similar. I would guess that if the disturbance is 50+ dB below the fundamental, you're probably good...
Yes. I have test equipment. However, time is probably the most valuable resource for me. I need to make sure I spend it wisely in ways that are conducive to either meet my project needs or earn me money.
Anybody with an external sound card and a little software will be able to take the measurements I just described. It's just a matter of actually doing the work.
~Tom
Last edited:
- Home
- Amplifiers
- Chip Amps
- LM3886 PCB vs Point-to-Point (with data)