maxpou said:
Hi Gootee,
are you sure it is not automatic?
Maxpou
Yes. I am sure.
It does have an "Automatic" mode switch. But that is only used AFTER it has been manually tuned, to handle small drifts or variations of fequency, or, sometimes, to get the last little bit of tuning adjustment, for the lowest THD reading.
The way the HP334A (and HP333A) distortion analyzer is typically used is as follows (paraphrasing the "Operating Procedures" from the manual): For distortion measurement in percent, with "Automatic Mode", you position the Function switch to Set Level, the Mode switch to Manual, the Sensitivity selector to Min, and the Sensitivity Vernier to Min (and turn on the high-pass filter if the freq is > 1 kHz). Then you Turn the Sensitivity Selector switch clockwise until the needle deflects at least 1/3 of full scale. Then you adjust the Sensitivity Vernier for full-scale deflection. Then you position the Frequency Range selector and the Frequency Vernier dial to the fundamental frequency of the signal. Then you set the Function switch to Distortion. Then you adjust the Meter Range switch and the Frequency Vernier for the minimum THD indication. Then you adjust the Coarse and Fine Balance controls for minimum THD indication. If you can get the reading to be less than 10% of the Set Level reading, you can then engage the Automatic mode. For Manual mode measurements, you just continue to play with the Frequency Vernier and the Balance controls, to get the minimum THD reading, instead of selecting the Automatic mode.
It's really not nearly as bad as it sounds, though.
maxpou said:
Hi Gootee,
i'm very disappointed because i have an audio generator with triangle waveform and scope! Maxpou
Why disappointed? Try it! You can also use the X-Y mode of your scope, with the input and output of an amplifier (one as X, the other as Y). As others have mentioned, in the middle of the frequency range, either way (triangle output, or X-Y mode with input & output) will give you an indication of linearity.
One of the "standard" worst-case THD measurements seems to be for 20 kHz, which I assumed could not be done with a PC and soundcard.
I would suggest 1 kHz, just as Nelson Pass always does. The reason is that higher harmonics of 20 kHz are already far beyond what we can hear (40 kHz would be 1st harmonic). So THD+N for 20 kHz is rather academic.
As worst case I consider really heavy loads like 2 Ohms were virtually all amplifiers I've seen perform far worse than at the 8 Ohms at which they are spec'd. And 2 Ohms are not an academic case, but do happen with for example ribbon tweeters or 2.5 way speakers.
All the best, Hannes
h_a said:
I would suggest 1 kHz, just as Nelson Pass always does. The reason is that higher harmonics of 20 kHz are already far beyond what we can hear (40 kHz would be 1st harmonic). So THD+N for 20 kHz is rather academic.
I think we had this discussion already quite often here... Your statement is obviously true for a single sinewave.
I suggest testing for IMD with a 19+20 khz signal and observe the "harmonics" generated at 1/18/21 khz and what else is generated.
Also a 5khz test is reasonable, this still gets visible harmonics up to 4th.
Mike
Bonsai said:BTW, I bought an Audigy Z2.
Nobody is perfect...

It is expensive, but still a consumer card.
Mike
Bonsai said:PMA,
I saw a plot of your card somewhere on antoher thread with -130dB noise floor. What card are your using?
You mean something like this?
It is M-Audio Fast Track USB, in 24bit/48kHz mode.
Attachments
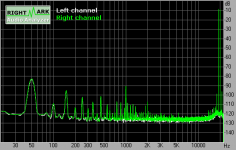
PMA said:Hereby the RMAA result...
The results state Noise as -98.6 , but then the graph shows a noise floor at approximately -130 . I do not understand... what am I missing?
PMA - is this the unit you are using?
USB 2.0 Audio Interface
E-MU's new 0202 USB 2.0 Audio Interface is the ultimate portable USB audio interface for PC, offering pristine 24-bit/192kHz recording and playback, direct monitoring and a host of professional features in a compact, USB bus-powered package. The 0202 USB sets a new standard in portable USB audio, providing users with two Class-A preamps that can be run independently or in stereo to amplify guitars, keyboards or microphones, with individual ground lift switches for optimal audio performance.
The E-MU 0202 USB 2.0 features:
Premium 24-bit/192kHz A/D and D/A converters* (A/D: 113dB SNR, D/A: 112dB SNR) deliver unmatched USB audio fidelity - gold-plated connectors for pristine audio quality
Ultra-low noise Mic/Hi-Z/Line preamplifiers with ground lift switches enable you to plug microphones, keyboards and guitars straight into your computer with professional results (XLR, 1/4" TRS, and 1/8" 5V condenser mic input)
Ultra-low latency USB 2.0 drivers offer accurate timing and playback of your recorded audio and software instruments
Hardware zero-latency direct monitoring (mono/stereo) allows you to record and overdub with no annoying delay
Plug-and-play operation with hands-on control of all major functions like direct monitoring level, headphone level, preamplifier gain and more
Compatibility with most popular audio/sequencer applications - (Windows XP/x64: ASIO2 and WDM; Macintosh OS X: Apple CoreAudio)
I/O Configuration:
Class-A Ultra-low Noise Mic/Hi-Z/Line Preamp XLR, 1/4" TRS and 1/8"* Inputs (113dB SNR)
Class-A Hi-Z/Line Preamp 1/4" Input (113dB SNR)
Two 1/4" Outputs (112dB SNR)
1/8" Stereo Speaker Output (112dB SNR)
Stereo Headphone Output (108dB SNR)
Gordy said:
The results state Noise as -98.6 , but then the graph shows a noise floor at approximately -130 . I do not understand... what am I missing?
There is a difference between noise-level and noise-floor visible in fft.
For example, a full scale white noise would give a noise-floor typically at somewhere between -30db and -40db in the fft (depending on the window size).
Mike
Gordy said:
The results state Noise as -98.6 , but then the graph shows a noise floor at approximately -130 . I do not understand... what am I missing?
You are missing the FFT basics. Narrow band noise floor depends on number of samples in the FFT record.
Theoretical SNR noise floor is:
SNR = 6.02N + 1.76dB + 10 log(M/2)
N ... number of bits
M ... number of samples in the FFT record
This is just narrow band noise floor.
- Status
- This old topic is closed. If you want to reopen this topic, contact a moderator using the "Report Post" button.
- Home
- Amplifiers
- Solid State
- Linearity